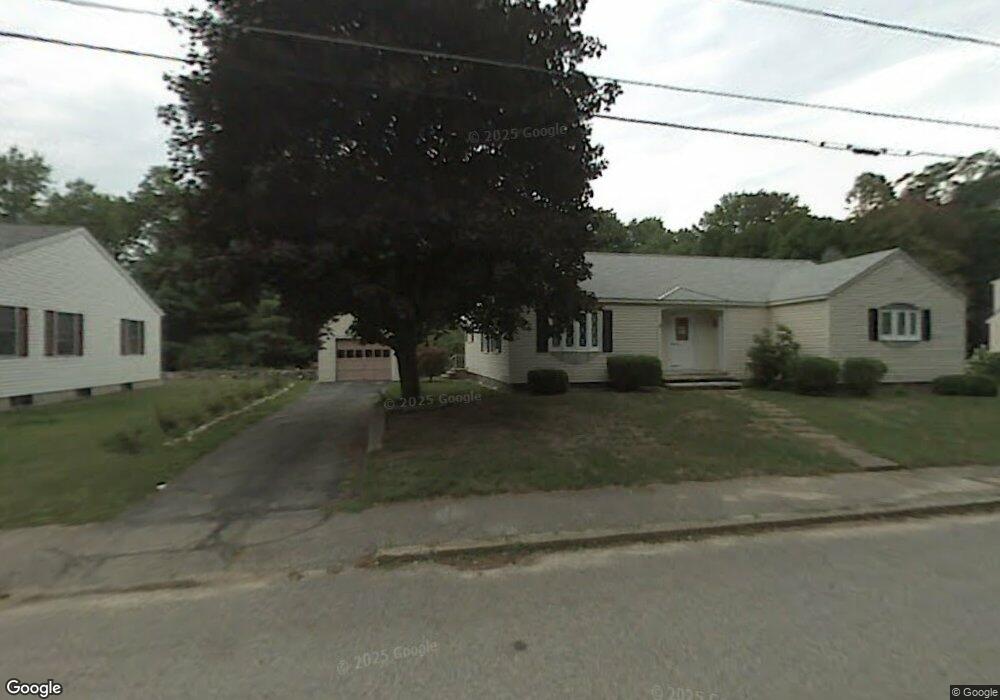
33 Highland St Webster, MA 01570
Estimated Value: $339,000 - $409,000
3
Beds
1
Bath
1,587
Sq Ft
$244/Sq Ft
Est. Value
About This Home
This home is located at 33 Highland St, Webster, MA 01570 and is currently estimated at $386,736, approximately $243 per square foot. 33 Highland St is a home located in Worcester County with nearby schools including Park Avenue Elementary School, Webster Middle School, and Bartlett High School.
Ownership History
Date
Name
Owned For
Owner Type
Purchase Details
Closed on
Dec 30, 2021
Sold by
Cianci Edward A
Bought by
Cianci Edward A and Frechette Raymond
Current Estimated Value
Purchase Details
Closed on
Dec 8, 2021
Sold by
Jp Morgan Chase Bank Na
Bought by
Cianci Edward A
Purchase Details
Closed on
Dec 2, 2019
Sold by
Menzone Dorothy P
Bought by
Jp Morgan Chase Bank Na
Purchase Details
Closed on
Aug 22, 2008
Sold by
Gleick Barbara and Glick Barbara
Bought by
Menzone Dorothy P
Home Financials for this Owner
Home Financials are based on the most recent Mortgage that was taken out on this home.
Original Mortgage
$209,587
Interest Rate
6.4%
Mortgage Type
Purchase Money Mortgage
Create a Home Valuation Report for This Property
The Home Valuation Report is an in-depth analysis detailing your home's value as well as a comparison with similar homes in the area
Home Values in the Area
Average Home Value in this Area
Purchase History
| Date | Buyer | Sale Price | Title Company |
|---|---|---|---|
| Cianci Edward A | -- | None Available | |
| Cianci Edward A | $181,800 | None Available | |
| Jp Morgan Chase Bank Na | $192,700 | None Available | |
| Menzone Dorothy P | $218,000 | -- |
Source: Public Records
Mortgage History
| Date | Status | Borrower | Loan Amount |
|---|---|---|---|
| Previous Owner | Menzone Dorothy P | $209,587 |
Source: Public Records
Tax History Compared to Growth
Tax History
| Year | Tax Paid | Tax Assessment Tax Assessment Total Assessment is a certain percentage of the fair market value that is determined by local assessors to be the total taxable value of land and additions on the property. | Land | Improvement |
|---|---|---|---|---|
| 2025 | $3,813 | $321,000 | $61,100 | $259,900 |
| 2024 | $3,764 | $309,000 | $58,800 | $250,200 |
| 2023 | $3,454 | $276,300 | $55,900 | $220,400 |
| 2022 | $3,437 | $246,200 | $54,300 | $191,900 |
| 2021 | $3,345 | $221,500 | $54,300 | $167,200 |
| 2020 | $3,259 | $216,400 | $54,300 | $162,100 |
| 2019 | $3,078 | $200,800 | $54,300 | $146,500 |
| 2018 | $2,835 | $184,200 | $51,900 | $132,300 |
| 2017 | $2,617 | $173,000 | $50,800 | $122,200 |
| 2016 | $2,521 | $166,500 | $48,400 | $118,100 |
| 2015 | $2,394 | $163,100 | $47,400 | $115,700 |
Source: Public Records
Map
Nearby Homes