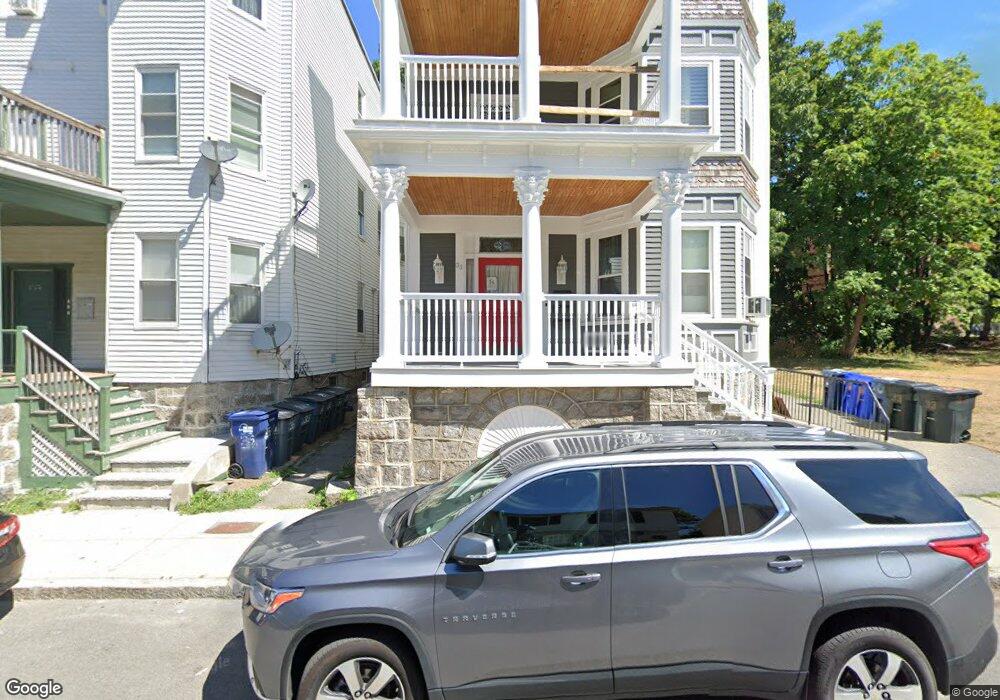
33 Hollander St Dorchester, MA 02121
Washington Park NeighborhoodEstimated Value: $892,000 - $1,087,000
9
Beds
3
Baths
4,230
Sq Ft
$227/Sq Ft
Est. Value
About This Home
This home is located at 33 Hollander St, Dorchester, MA 02121 and is currently estimated at $959,683, approximately $226 per square foot. 33 Hollander St is a home located in Suffolk County with nearby schools including Bridge Boston Charter School.
Ownership History
Date
Name
Owned For
Owner Type
Purchase Details
Closed on
Nov 6, 2025
Sold by
33 Hollander Street Rt and Owens
Bought by
Vivian M White Rt and White
Current Estimated Value
Purchase Details
Closed on
Oct 1, 2024
Sold by
White Vivian
Bought by
33 Hollander Street Rt and Andrews
Purchase Details
Closed on
Oct 18, 1999
Sold by
Hollander St Rt and Blasikiewicz
Bought by
White Vivan M
Purchase Details
Closed on
Apr 30, 1999
Sold by
Independent T and Allen
Bought by
Hollander Street Rt 33 and Blasikiewicz
Purchase Details
Closed on
Mar 31, 1999
Sold by
Sullivan Eleanor L Est and Ifill
Bought by
Independent T and Allen
Create a Home Valuation Report for This Property
The Home Valuation Report is an in-depth analysis detailing your home's value as well as a comparison with similar homes in the area
Home Values in the Area
Average Home Value in this Area
Purchase History
| Date | Buyer | Sale Price | Title Company |
|---|---|---|---|
| Vivian M White Rt | -- | -- | |
| 33 Hollander Street Rt | -- | None Available | |
| 33 Hollander Street Rt | -- | None Available | |
| White Vivan M | $225,000 | -- | |
| White Vivan M | $225,000 | -- | |
| Hollander Street Rt 33 | $89,000 | -- | |
| Hollander Street Rt 33 | $89,000 | -- | |
| Independent T | $45,000 | -- | |
| Independent T | $45,000 | -- |
Source: Public Records
Mortgage History
| Date | Status | Borrower | Loan Amount |
|---|---|---|---|
| Previous Owner | Independent T | $5,000 | |
| Previous Owner | Independent T | $244,000 |
Source: Public Records
Tax History Compared to Growth
Tax History
| Year | Tax Paid | Tax Assessment Tax Assessment Total Assessment is a certain percentage of the fair market value that is determined by local assessors to be the total taxable value of land and additions on the property. | Land | Improvement |
|---|---|---|---|---|
| 2025 | $8,429 | $727,900 | $202,800 | $525,100 |
| 2024 | $7,909 | $725,600 | $193,300 | $532,300 |
| 2023 | $6,955 | $647,600 | $172,500 | $475,100 |
| 2022 | $6,297 | $578,800 | $161,200 | $417,600 |
| 2021 | $5,938 | $556,500 | $155,000 | $401,500 |
| 2020 | $4,986 | $472,200 | $147,200 | $325,000 |
| 2019 | $4,408 | $418,200 | $119,700 | $298,500 |
| 2018 | $4,172 | $398,100 | $119,700 | $278,400 |
| 2017 | $4,216 | $398,100 | $119,700 | $278,400 |
| 2016 | $3,808 | $346,200 | $119,700 | $226,500 |
| 2015 | $3,369 | $278,200 | $102,900 | $175,300 |
| 2014 | $3,125 | $248,400 | $102,900 | $145,500 |
Source: Public Records
Map
Nearby Homes
- 99 Harrishof St
- 151 Townsend St
- 9 Abbotsford St Unit 1
- 28 Wabon St
- 90 Munroe St
- 75 Ruthven St
- 4 Ruthven St
- 214 Humboldt Ave
- 4 Wyoming St Unit 2
- 16 Mayfair St
- 164 Ruthven St Unit 1
- 495 Warren St
- 7 Waumbeck St Unit 3
- 476 Warren St
- 8 Brinton St Unit 2
- 41 W Walnut Park
- 78 Hutchings St Unit 1
- 2856 Washington St
- 5 Glenburne St
- 35-37 Notre Dame St
- 33 Hollander St Unit 1 & 3
- 33 Hollander St Unit 3
- 33 Hollander St Unit 1
- 35 Hollander St
- 35 Hollander St Unit 3
- 35 Hollander St Unit 2
- 37 Hollander St
- 27 Hollander St
- 32 Hollander St
- 39 Hollander St
- 39 Hollander St Unit 1
- 39 Hollander St Unit 2
- 26 Hollander St
- 28 Hollander St
- 24 Hollander St
- 30 Hollander St
- 60 Holworthy St Unit 6
- 60 Holworthy St Unit 4
- 60 Holworthy St Unit 3
- 60 Holworthy St Unit 1