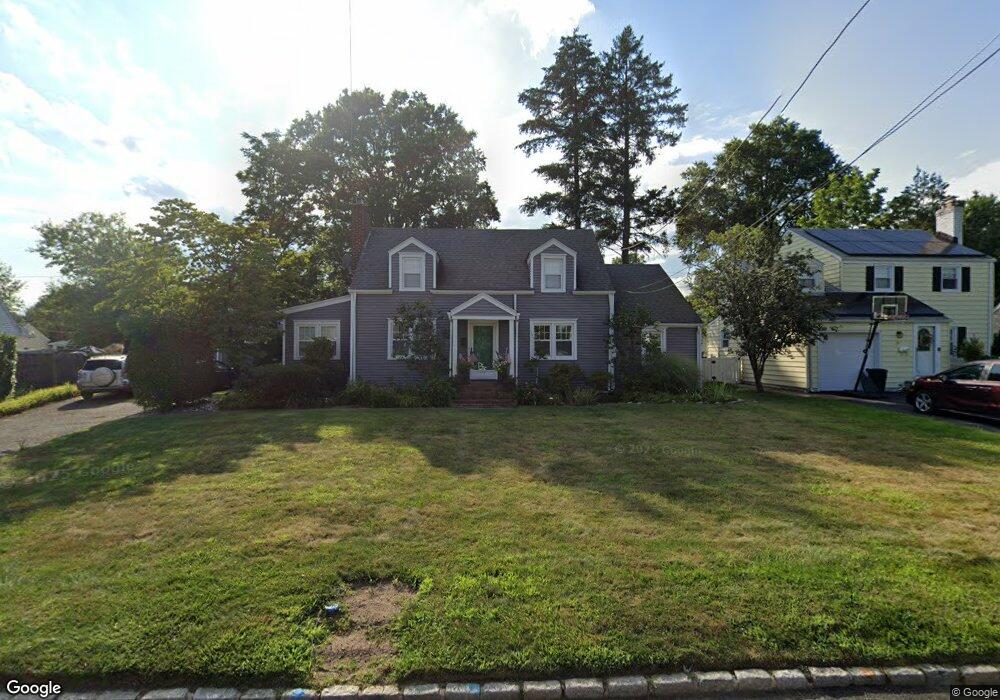
33 Jacob St Bloomfield, NJ 07003
Estimated Value: $688,000 - $939,000
--
Bed
--
Bath
1,818
Sq Ft
$425/Sq Ft
Est. Value
About This Home
This home is located at 33 Jacob St, Bloomfield, NJ 07003 and is currently estimated at $772,750, approximately $425 per square foot. 33 Jacob St is a home located in Essex County with nearby schools including Brookdale School, Bloomfield Middle School, and Bloomfield High School.
Ownership History
Date
Name
Owned For
Owner Type
Purchase Details
Closed on
Nov 9, 1999
Sold by
Macedonal Ministries
Bought by
Roane Everett and Roane Linda
Current Estimated Value
Home Financials for this Owner
Home Financials are based on the most recent Mortgage that was taken out on this home.
Original Mortgage
$140,000
Outstanding Balance
$42,512
Interest Rate
7.68%
Estimated Equity
$730,238
Purchase Details
Closed on
Sep 8, 1997
Sold by
Rawding Ernest
Bought by
Richards Martin and Richards Karen
Home Financials for this Owner
Home Financials are based on the most recent Mortgage that was taken out on this home.
Original Mortgage
$145,000
Interest Rate
7.46%
Create a Home Valuation Report for This Property
The Home Valuation Report is an in-depth analysis detailing your home's value as well as a comparison with similar homes in the area
Home Values in the Area
Average Home Value in this Area
Purchase History
| Date | Buyer | Sale Price | Title Company |
|---|---|---|---|
| Roane Everett | $140,000 | -- | |
| Richards Martin | $187,000 | -- |
Source: Public Records
Mortgage History
| Date | Status | Borrower | Loan Amount |
|---|---|---|---|
| Open | Roane Everett | $140,000 | |
| Previous Owner | Richards Martin | $145,000 |
Source: Public Records
Tax History Compared to Growth
Tax History
| Year | Tax Paid | Tax Assessment Tax Assessment Total Assessment is a certain percentage of the fair market value that is determined by local assessors to be the total taxable value of land and additions on the property. | Land | Improvement |
|---|---|---|---|---|
| 2025 | $14,565 | $445,700 | $191,900 | $253,800 |
| 2024 | $14,565 | $445,700 | $191,900 | $253,800 |
| 2022 | $14,271 | $445,700 | $191,900 | $253,800 |
| 2021 | $14,008 | $445,700 | $191,900 | $253,800 |
| 2020 | $13,794 | $445,700 | $191,900 | $253,800 |
| 2019 | $12,723 | $319,600 | $169,000 | $150,600 |
| 2018 | $12,669 | $319,600 | $169,000 | $150,600 |
| 2017 | $12,477 | $319,600 | $169,000 | $150,600 |
| 2016 | $12,337 | $319,600 | $169,000 | $150,600 |
| 2015 | $12,225 | $319,600 | $169,000 | $150,600 |
| 2014 | $12,001 | $319,600 | $169,000 | $150,600 |
Source: Public Records
Map
Nearby Homes