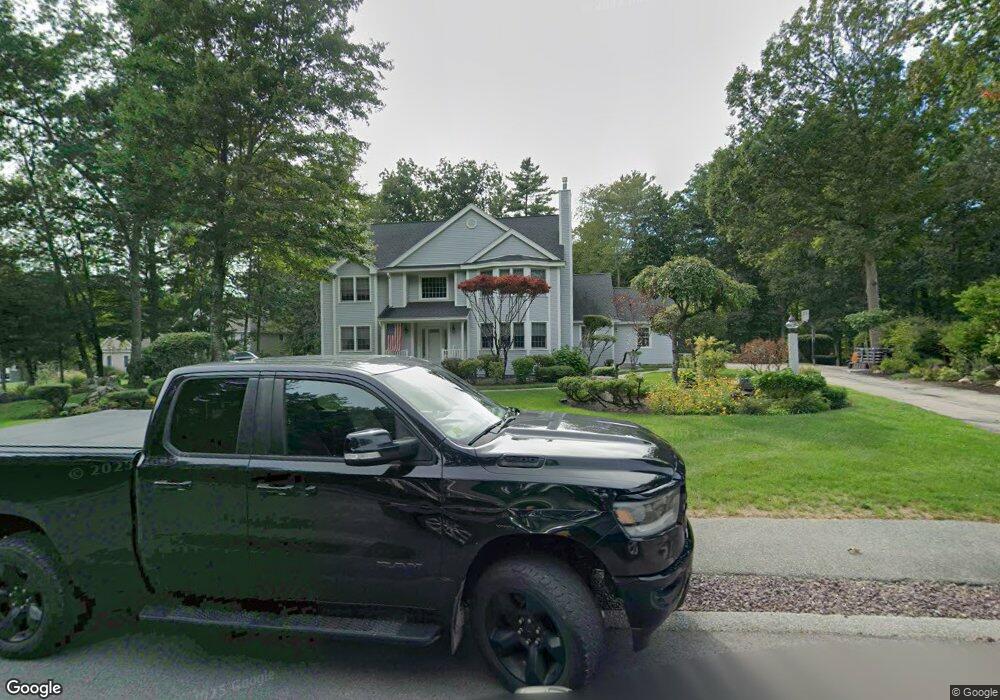
33 Jambard Rd Hollis, NH 03049
Hollis NeighborhoodEstimated Value: $958,057 - $1,332,000
4
Beds
3
Baths
4,258
Sq Ft
$274/Sq Ft
Est. Value
About This Home
This home is located at 33 Jambard Rd, Hollis, NH 03049 and is currently estimated at $1,165,514, approximately $273 per square foot. 33 Jambard Rd is a home located in Hillsborough County with nearby schools including Hollis Primary School, Hollis Upper Elementary School, and Hollis-Brookline Middle School.
Ownership History
Date
Name
Owned For
Owner Type
Purchase Details
Closed on
Oct 21, 2025
Sold by
Giaconia Andrew S and Giaconia Robin C
Bought by
Arg Ret and Giaconia
Current Estimated Value
Purchase Details
Closed on
Jun 16, 2010
Sold by
Levine Ft and Levine
Bought by
Gianconia Andrew S and Gianconia Robin C
Home Financials for this Owner
Home Financials are based on the most recent Mortgage that was taken out on this home.
Original Mortgage
$400,000
Interest Rate
5.03%
Mortgage Type
Purchase Money Mortgage
Create a Home Valuation Report for This Property
The Home Valuation Report is an in-depth analysis detailing your home's value as well as a comparison with similar homes in the area
Home Values in the Area
Average Home Value in this Area
Purchase History
| Date | Buyer | Sale Price | Title Company |
|---|---|---|---|
| Arg Ret | -- | -- | |
| Gianconia Andrew S | $525,000 | -- |
Source: Public Records
Mortgage History
| Date | Status | Borrower | Loan Amount |
|---|---|---|---|
| Previous Owner | Gianconia Andrew S | $417,000 | |
| Previous Owner | Gianconia Andrew S | $400,000 | |
| Previous Owner | Gianconia Andrew S | $100,000 |
Source: Public Records
Tax History Compared to Growth
Tax History
| Year | Tax Paid | Tax Assessment Tax Assessment Total Assessment is a certain percentage of the fair market value that is determined by local assessors to be the total taxable value of land and additions on the property. | Land | Improvement |
|---|---|---|---|---|
| 2024 | $15,413 | $869,300 | $291,400 | $577,900 |
| 2023 | $14,483 | $869,300 | $291,400 | $577,900 |
| 2022 | $19,620 | $869,300 | $291,400 | $577,900 |
| 2021 | $12,476 | $549,600 | $186,700 | $362,900 |
| 2020 | $12,740 | $549,600 | $186,700 | $362,900 |
| 2019 | $12,696 | $549,600 | $186,700 | $362,900 |
| 2018 | $11,927 | $550,400 | $186,700 | $363,700 |
| 2017 | $11,649 | $503,200 | $161,400 | $341,800 |
| 2016 | $11,790 | $503,200 | $161,400 | $341,800 |
| 2015 | $11,577 | $502,900 | $161,400 | $341,500 |
| 2014 | $11,632 | $502,900 | $161,400 | $341,500 |
| 2013 | $11,679 | $511,800 | $161,400 | $350,400 |
Source: Public Records
Map
Nearby Homes