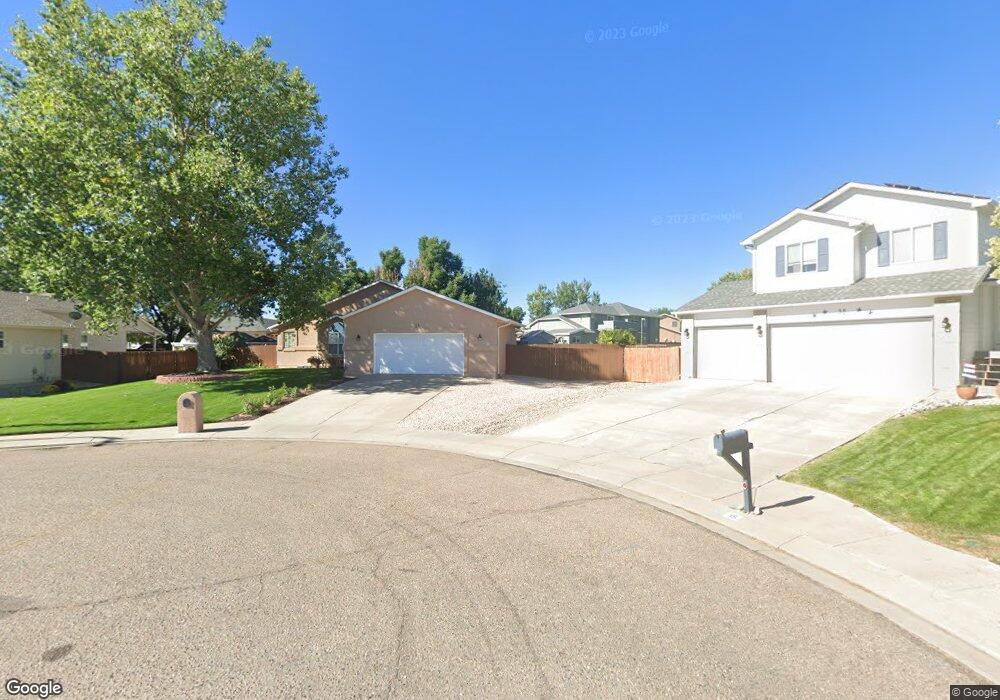
33 La Habre Dr Pueblo, CO 81005
El Camino NeighborhoodEstimated Value: $365,617 - $422,000
3
Beds
3
Baths
1,581
Sq Ft
$251/Sq Ft
Est. Value
About This Home
This home is located at 33 La Habre Dr, Pueblo, CO 81005 and is currently estimated at $396,654, approximately $250 per square foot. 33 La Habre Dr is a home located in Pueblo County with nearby schools including Highland Park Elementary School, Roncalli STEM Academy, and South High School.
Ownership History
Date
Name
Owned For
Owner Type
Purchase Details
Closed on
Nov 24, 2010
Sold by
Ortiz Lawrence and Ortiz Anita G
Bought by
Ortiz Lawrence R and Ortiz Anita G
Current Estimated Value
Home Financials for this Owner
Home Financials are based on the most recent Mortgage that was taken out on this home.
Original Mortgage
$151,000
Outstanding Balance
$3,250
Interest Rate
3.64%
Mortgage Type
New Conventional
Estimated Equity
$393,404
Purchase Details
Closed on
Feb 6, 2003
Sold by
Owen Keith E + Georgina
Bought by
Ortiz Lawrence + Anita G
Purchase Details
Closed on
Jun 24, 1996
Sold by
Pannunzio Inc
Bought by
Owen Keith E + Georgina
Purchase Details
Closed on
Mar 6, 1996
Bought by
Pannunzio Inc
Purchase Details
Closed on
Oct 1, 1993
Bought by
Ed Robinson + Assoc Inc
Create a Home Valuation Report for This Property
The Home Valuation Report is an in-depth analysis detailing your home's value as well as a comparison with similar homes in the area
Home Values in the Area
Average Home Value in this Area
Purchase History
| Date | Buyer | Sale Price | Title Company |
|---|---|---|---|
| Ortiz Lawrence R | -- | Stewart Title | |
| Ortiz Lawrence + Anita G | $212,500 | -- | |
| Owen Keith E + Georgina | $142,900 | -- | |
| Pannunzio Inc | $26,900 | -- | |
| Ed Robinson + Assoc Inc | -- | -- |
Source: Public Records
Mortgage History
| Date | Status | Borrower | Loan Amount |
|---|---|---|---|
| Open | Ortiz Lawrence R | $151,000 |
Source: Public Records
Tax History Compared to Growth
Tax History
| Year | Tax Paid | Tax Assessment Tax Assessment Total Assessment is a certain percentage of the fair market value that is determined by local assessors to be the total taxable value of land and additions on the property. | Land | Improvement |
|---|---|---|---|---|
| 2024 | $1,533 | $22,200 | -- | -- |
| 2023 | $1,549 | $25,890 | $3,020 | $22,870 |
| 2022 | $1,215 | $19,050 | $3,130 | $15,920 |
| 2021 | $1,952 | $19,600 | $3,220 | $16,380 |
| 2020 | $1,795 | $19,597 | $3,220 | $16,377 |
| 2019 | $1,796 | $17,784 | $2,281 | $15,503 |
| 2018 | $1,562 | $17,235 | $2,297 | $14,938 |
| 2017 | $1,577 | $17,235 | $2,297 | $14,938 |
| 2016 | $1,549 | $17,051 | $2,539 | $14,512 |
| 2015 | $1,543 | $17,051 | $2,539 | $14,512 |
| 2014 | $1,498 | $16,519 | $2,539 | $13,980 |
Source: Public Records
Map
Nearby Homes
- 37 Portero Dr
- 172 Encino Dr
- 204 Bridle Trail
- 212 Bridle Trail
- 194 Bridle Trail
- 303 Starlite Dr
- 80 Portero Dr
- 123 Carrillon Ln
- 3940 Hollybrook Ln
- 10 Verdosa Dr
- 37 Verdosa Dr
- 45 Sepulveda Dr
- 208 Starlite Dr
- 3935 Farabaugh Ln
- 2137 Chautard Dr
- 0 Bandera Pkwy Unit REC6780822
- 232 Alhambra Dr
- 2107 Chatalet Ln Unit D
- 2133 Oakwood Ln
- 3914 Bison Ln