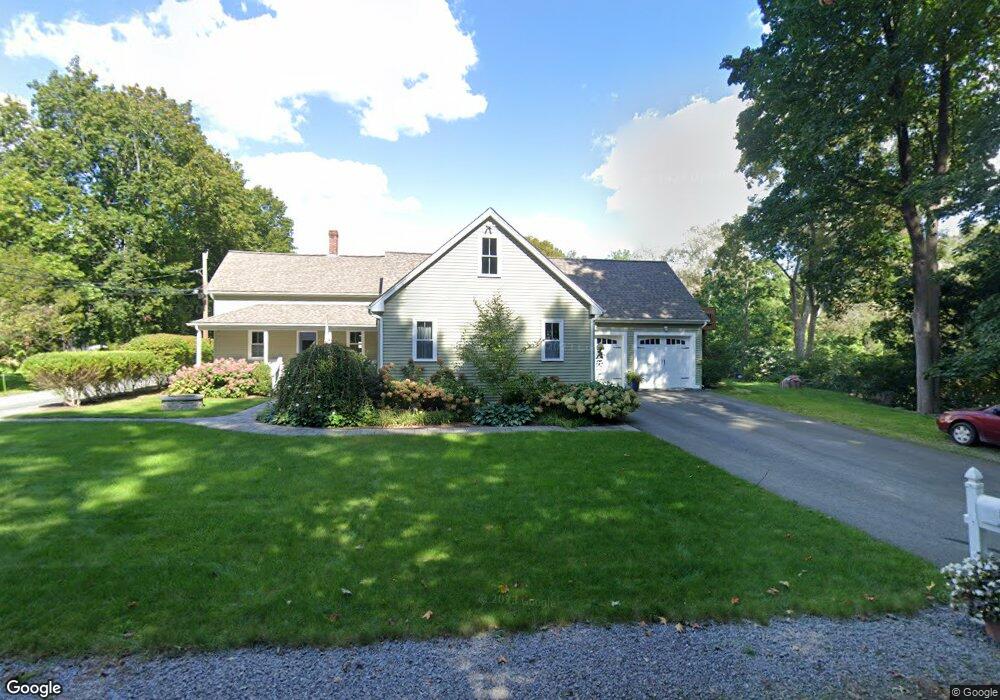
33 Leach Ln Natick, MA 01760
Estimated Value: $810,000 - $1,186,000
4
Beds
2
Baths
1,794
Sq Ft
$559/Sq Ft
Est. Value
About This Home
This home is located at 33 Leach Ln, Natick, MA 01760 and is currently estimated at $1,002,867, approximately $559 per square foot. 33 Leach Ln is a home located in Middlesex County with nearby schools including Natick High School, Memorial Elementary School, and J F Kennedy Middle School.
Ownership History
Date
Name
Owned For
Owner Type
Purchase Details
Closed on
Jun 8, 2005
Sold by
Kls Rt
Bought by
Sibley Diane F and Sibley Shaun S
Current Estimated Value
Home Financials for this Owner
Home Financials are based on the most recent Mortgage that was taken out on this home.
Original Mortgage
$322,400
Outstanding Balance
$165,394
Interest Rate
5.79%
Mortgage Type
Purchase Money Mortgage
Estimated Equity
$837,473
Purchase Details
Closed on
Dec 31, 2003
Sold by
Soderholm Samuel A
Bought by
Kls Rt
Purchase Details
Closed on
Jun 14, 2001
Sold by
Garcia-Carranza Daniel
Bought by
Soderholdm Samuel A
Home Financials for this Owner
Home Financials are based on the most recent Mortgage that was taken out on this home.
Original Mortgage
$180,000
Interest Rate
7.15%
Mortgage Type
Purchase Money Mortgage
Create a Home Valuation Report for This Property
The Home Valuation Report is an in-depth analysis detailing your home's value as well as a comparison with similar homes in the area
Home Values in the Area
Average Home Value in this Area
Purchase History
| Date | Buyer | Sale Price | Title Company |
|---|---|---|---|
| Sibley Diane F | $403,000 | -- | |
| Kls Rt | -- | -- | |
| Soderholdm Samuel A | $190,000 | -- |
Source: Public Records
Mortgage History
| Date | Status | Borrower | Loan Amount |
|---|---|---|---|
| Open | Sibley Diane F | $322,400 | |
| Previous Owner | Soderholdm Samuel A | $180,000 |
Source: Public Records
Tax History Compared to Growth
Tax History
| Year | Tax Paid | Tax Assessment Tax Assessment Total Assessment is a certain percentage of the fair market value that is determined by local assessors to be the total taxable value of land and additions on the property. | Land | Improvement |
|---|---|---|---|---|
| 2025 | $10,489 | $877,000 | $452,000 | $425,000 |
| 2024 | $10,056 | $820,200 | $426,900 | $393,300 |
| 2023 | $9,903 | $783,500 | $401,600 | $381,900 |
| 2022 | $9,601 | $719,700 | $366,300 | $353,400 |
| 2021 | $6,495 | $663,000 | $346,200 | $316,800 |
| 2020 | $8,725 | $627,700 | $331,200 | $296,500 |
| 2019 | $6,144 | $627,700 | $331,200 | $296,500 |
| 2018 | $5,100 | $383,200 | $316,100 | $67,100 |
| 2017 | $4,828 | $357,900 | $276,500 | $81,400 |
| 2016 | $4,482 | $330,300 | $264,600 | $65,700 |
| 2015 | $4,494 | $325,200 | $264,600 | $60,600 |
Source: Public Records
Map
Nearby Homes