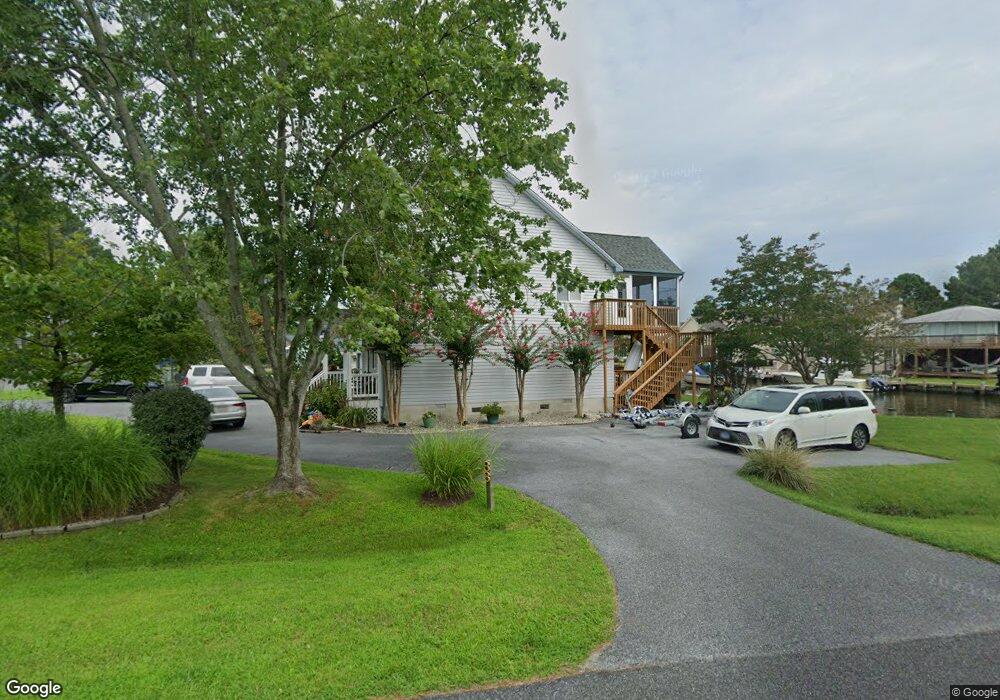
33 Lookout Point Berlin, MD 21811
Estimated Value: $707,000 - $815,000
5
Beds
3
Baths
2,313
Sq Ft
$326/Sq Ft
Est. Value
About This Home
This home is located at 33 Lookout Point, Berlin, MD 21811 and is currently estimated at $753,130, approximately $325 per square foot. 33 Lookout Point is a home located in Worcester County with nearby schools including Showell Elementary School, Stephen Decatur Middle School, and Berlin Intermediate School.
Ownership History
Date
Name
Owned For
Owner Type
Purchase Details
Closed on
Jul 6, 2012
Sold by
Snyder Roger E and Snyder Carol A
Bought by
Heistand Steven H and Heistand Sue A
Current Estimated Value
Purchase Details
Closed on
Dec 5, 2001
Sold by
Partridge William R and Partridge Phyllis S
Bought by
Collins Daniel J and Collins Nancy E
Purchase Details
Closed on
Jul 24, 2001
Sold by
Tolson George F Trustee
Bought by
Partridge William R and Partridge Phyllis S
Purchase Details
Closed on
Oct 17, 1985
Sold by
Hand William E
Bought by
Snyder Roger E and Snyder Carol A
Purchase Details
Closed on
Sep 6, 1984
Sold by
Faillace Joseph N
Bought by
Hand William E
Home Financials for this Owner
Home Financials are based on the most recent Mortgage that was taken out on this home.
Original Mortgage
$58,500
Interest Rate
14.38%
Create a Home Valuation Report for This Property
The Home Valuation Report is an in-depth analysis detailing your home's value as well as a comparison with similar homes in the area
Home Values in the Area
Average Home Value in this Area
Purchase History
| Date | Buyer | Sale Price | Title Company |
|---|---|---|---|
| Heistand Steven H | $288,500 | -- | |
| Collins Daniel J | $132,250 | -- | |
| Partridge William R | $90,000 | -- | |
| Snyder Roger E | $79,900 | -- | |
| Hand William E | $65,000 | -- |
Source: Public Records
Mortgage History
| Date | Status | Borrower | Loan Amount |
|---|---|---|---|
| Previous Owner | Hand William E | $58,500 | |
| Closed | Partridge William R | -- |
Source: Public Records
Tax History
| Year | Tax Paid | Tax Assessment Tax Assessment Total Assessment is a certain percentage of the fair market value that is determined by local assessors to be the total taxable value of land and additions on the property. | Land | Improvement |
|---|---|---|---|---|
| 2025 | $4,131 | $485,600 | $0 | $0 |
| 2024 | $4,106 | $431,000 | $199,500 | $231,500 |
| 2023 | $3,996 | $419,367 | $0 | $0 |
| 2022 | $3,885 | $407,733 | $0 | $0 |
| 2021 | $3,791 | $396,100 | $197,600 | $198,500 |
| 2020 | $3,746 | $391,400 | $0 | $0 |
| 2019 | $3,701 | $386,700 | $0 | $0 |
| 2018 | $3,602 | $382,000 | $197,600 | $184,400 |
| 2017 | $3,322 | $350,833 | $0 | $0 |
| 2016 | -- | $319,667 | $0 | $0 |
| 2015 | $3,393 | $288,500 | $0 | $0 |
| 2014 | $3,393 | $288,500 | $0 | $0 |
Source: Public Records
Map
Nearby Homes
- 10 Lookout Point
- 113 Teal Cir
- 96 Teal Cir
- 61 Grand Port Rd
- 80 Teal Cir
- 22 Harborview Dr
- 21 Seabreeze Rd
- 392 Ocean Pkwy
- 31 Watergreen Ln
- 306 Ocean Pkwy
- 17 Widows Watch Ct
- 240 Teal Cir
- 289 Ocean Pkwy
- 6 Sundial Cir
- 101 White Sail Cir
- 9 Sailors Way
- 12 Sailors Way
- 51 Newport Dr
- 45 Clubhouse Dr
- 27 Newport Dr
Your Personal Tour Guide
Ask me questions while you tour the home.