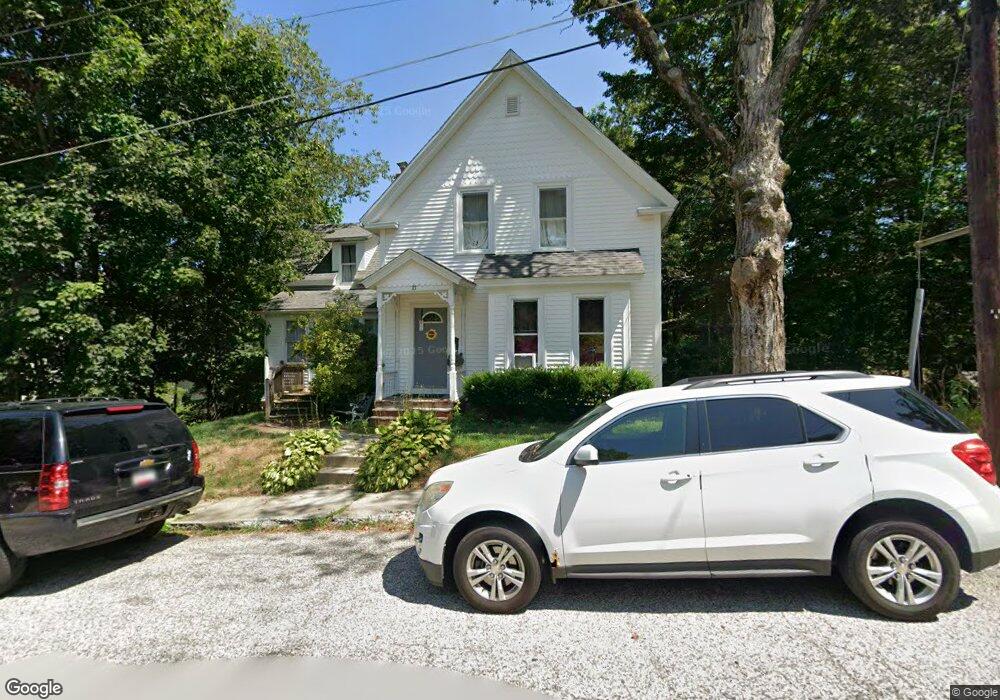
33 Maynard St Orange, MA 01364
Estimated Value: $274,000 - $345,000
3
Beds
2
Baths
1,471
Sq Ft
$210/Sq Ft
Est. Value
About This Home
This home is located at 33 Maynard St, Orange, MA 01364 and is currently estimated at $309,228, approximately $210 per square foot. 33 Maynard St is a home located in Franklin County with nearby schools including Fisher Hill and Ralph C Mahar Regional School.
Ownership History
Date
Name
Owned For
Owner Type
Purchase Details
Closed on
Dec 23, 1987
Sold by
Nilsson Glenn W
Bought by
Whelan Thomas
Current Estimated Value
Home Financials for this Owner
Home Financials are based on the most recent Mortgage that was taken out on this home.
Original Mortgage
$47,500
Interest Rate
10.67%
Mortgage Type
Purchase Money Mortgage
Create a Home Valuation Report for This Property
The Home Valuation Report is an in-depth analysis detailing your home's value as well as a comparison with similar homes in the area
Home Values in the Area
Average Home Value in this Area
Purchase History
| Date | Buyer | Sale Price | Title Company |
|---|---|---|---|
| Whelan Thomas | $95,000 | -- |
Source: Public Records
Mortgage History
| Date | Status | Borrower | Loan Amount |
|---|---|---|---|
| Closed | Whelan Thomas | $39,000 | |
| Closed | Whelan Thomas | $23,278 | |
| Closed | Whelan Thomas | $47,500 |
Source: Public Records
Tax History
| Year | Tax Paid | Tax Assessment Tax Assessment Total Assessment is a certain percentage of the fair market value that is determined by local assessors to be the total taxable value of land and additions on the property. | Land | Improvement |
|---|---|---|---|---|
| 2025 | $41 | $246,700 | $29,600 | $217,100 |
| 2024 | $3,921 | $224,800 | $29,600 | $195,200 |
| 2023 | $3,324 | $185,100 | $29,600 | $155,500 |
| 2022 | $2,988 | $156,300 | $26,600 | $129,700 |
| 2021 | $3,003 | $149,800 | $45,200 | $104,600 |
| 2020 | $2,860 | $140,700 | $41,200 | $99,500 |
| 2019 | $2,815 | $125,000 | $35,700 | $89,300 |
| 2018 | $2,517 | $114,700 | $33,300 | $81,400 |
| 2017 | $2,435 | $114,700 | $33,300 | $81,400 |
| 2016 | $2,285 | $105,300 | $29,700 | $75,600 |
| 2015 | $2,229 | $107,300 | $31,700 | $75,600 |
| 2014 | $2,274 | $115,200 | $31,700 | $83,500 |
Source: Public Records
Map
Nearby Homes
- 222 W River St
- 166-168 W Main St
- 83 W Main St
- 35 Ball St
- 30 Cottage St
- 56 Shelter St
- 12-14 E Main St
- 36 Summit St Unit A
- 36 Summit St Unit B
- 22 School St
- 313-315 Walnut Hill Rd
- 50 E Main St
- 58 E Main St
- 270 S Main St
- 23 E Howe St
- 216 Holtshire Rd
- 490 S Main St
- 246 Holtshire Rd Unit Lot 3
- 00 S Main St
- 000 S Main St
- 28 Highland St
- 36 Highland St
- 27 Maynard St
- 20 Highland St
- 28 Maynard St
- 38 Maynard St
- 21 Maynard St
- 17 Shumway St
- 44 Highland St
- 14 Highland St
- 14 Highland St Unit 1
- 14 Highland St Unit 2
- 37 Highland St
- 15 Maynard St
- 29 Highland St
- 29 Shumway St
- 10 Highland St
- 43 Highland St
- 21 Highland St
- 15 Highland St
Your Personal Tour Guide
Ask me questions while you tour the home.