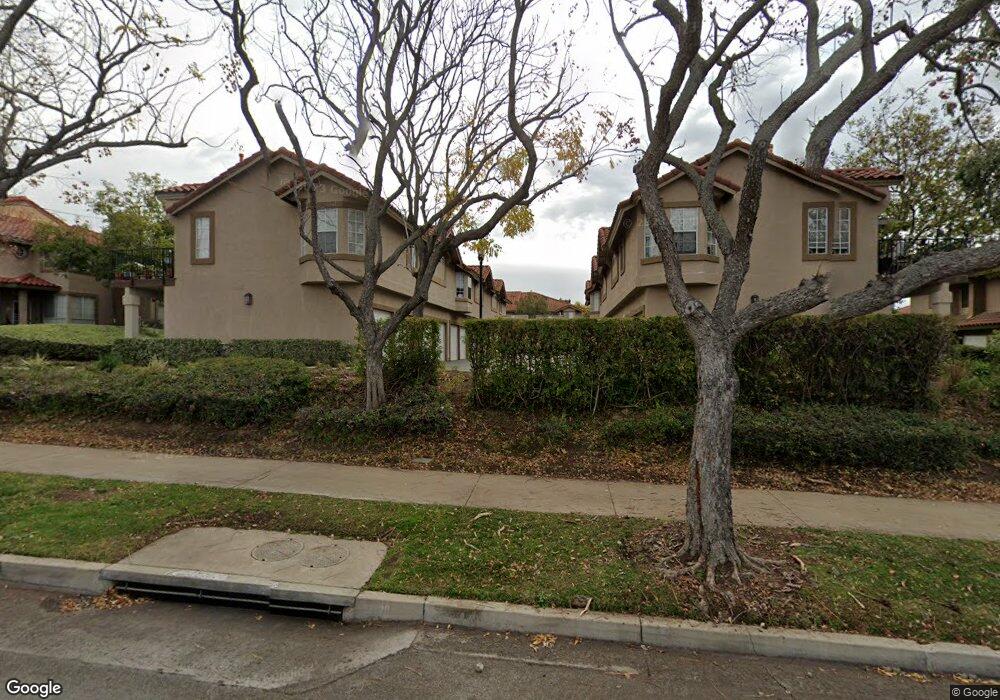
33 Milkwood Rancho Santa Margarita, CA 92688
Estimated Value: $572,684 - $623,000
2
Beds
2
Baths
832
Sq Ft
$721/Sq Ft
Est. Value
About This Home
This home is located at 33 Milkwood, Rancho Santa Margarita, CA 92688 and is currently estimated at $599,921, approximately $721 per square foot. 33 Milkwood is a home located in Orange County with nearby schools including Trabuco Mesa Elementary School, Rancho Santa Margarita Intermediate School, and Trabuco Hills High School.
Ownership History
Date
Name
Owned For
Owner Type
Purchase Details
Closed on
Mar 9, 2017
Sold by
Cummings Margaret Ann
Bought by
Long Katharine P and Long Travis J
Current Estimated Value
Home Financials for this Owner
Home Financials are based on the most recent Mortgage that was taken out on this home.
Original Mortgage
$333,000
Outstanding Balance
$275,988
Interest Rate
4.15%
Mortgage Type
New Conventional
Estimated Equity
$323,933
Purchase Details
Closed on
Nov 29, 2012
Sold by
Cummings Margaret Ann
Bought by
Cummings Margaret Ann
Home Financials for this Owner
Home Financials are based on the most recent Mortgage that was taken out on this home.
Original Mortgage
$72,500
Interest Rate
3.36%
Mortgage Type
New Conventional
Purchase Details
Closed on
Apr 16, 2012
Sold by
Cummings Margaret A
Bought by
Cummings Margaret Ann and Margaret Ann Cummings Trust
Create a Home Valuation Report for This Property
The Home Valuation Report is an in-depth analysis detailing your home's value as well as a comparison with similar homes in the area
Home Values in the Area
Average Home Value in this Area
Purchase History
| Date | Buyer | Sale Price | Title Company |
|---|---|---|---|
| Long Katharine P | $370,000 | Chicago Title | |
| Cummings Margaret Ann | -- | Ticor Title | |
| Cummings Margaret Ann | -- | None Available |
Source: Public Records
Mortgage History
| Date | Status | Borrower | Loan Amount |
|---|---|---|---|
| Open | Long Katharine P | $333,000 | |
| Previous Owner | Cummings Margaret Ann | $72,500 |
Source: Public Records
Tax History Compared to Growth
Tax History
| Year | Tax Paid | Tax Assessment Tax Assessment Total Assessment is a certain percentage of the fair market value that is determined by local assessors to be the total taxable value of land and additions on the property. | Land | Improvement |
|---|---|---|---|---|
| 2025 | $4,343 | $429,412 | $345,484 | $83,928 |
| 2024 | $4,343 | $420,993 | $338,710 | $82,283 |
| 2023 | $4,244 | $412,739 | $332,069 | $80,670 |
| 2022 | $4,172 | $404,647 | $325,558 | $79,089 |
| 2021 | $3,645 | $396,713 | $319,174 | $77,539 |
| 2020 | $4,062 | $392,646 | $315,902 | $76,744 |
| 2019 | $4,618 | $384,948 | $309,708 | $75,240 |
| 2018 | $4,553 | $377,400 | $303,635 | $73,765 |
| 2017 | $2,389 | $208,244 | $103,173 | $105,071 |
| 2016 | $2,663 | $204,161 | $101,150 | $103,011 |
| 2015 | $2,756 | $201,095 | $99,631 | $101,464 |
| 2014 | $2,707 | $197,156 | $97,679 | $99,477 |
Source: Public Records
Map
Nearby Homes
- 21 Silktassel
- 16 Las Piedras
- 25 Dewberry
- 73 Gaviota
- 31 Gaviota Unit 136
- 28 Montana Del Lago Dr Unit 159
- 54 Gavilan
- 70 Gavilan Unit 18
- 225 Montana Del Lago Dr
- 231 Montana Del Lago Dr Unit 22
- 250 Montana Del Lago Dr
- 4 Pica Flor Unit 54
- 1 El Canto
- 31 Brisa Del Lago
- 1 Brisa Del Lago
- 15 Temecula Ct
- 34 Dianthus
- 12 El Vaquero
- 21 Lobelia
- 19 Vista Barranca Unit 75
- 33 Milkwood Unit 112
- 31 Milkwood
- 29 Milkwood Unit 114
- 27 Milkwood Unit 104
- 23 Milkwood Unit 102
- 21 Milkwood Unit 101
- 21 Milkwood
- 19 Milkwood Unit 100
- 17 Milkwood
- 13 Milkwood Unit 111
- 15 Milkwood Unit 98
- 11 Milkwood Unit 110
- 7 Milkwood Unit 108
- 5 Milkwood
- 1 Milkwood Unit 105
- 1 Milkwood
- 26 Hemlock
- 32 Milkwood Unit 117
- 30 Hemlock Unit 191
- 30 Hemlock