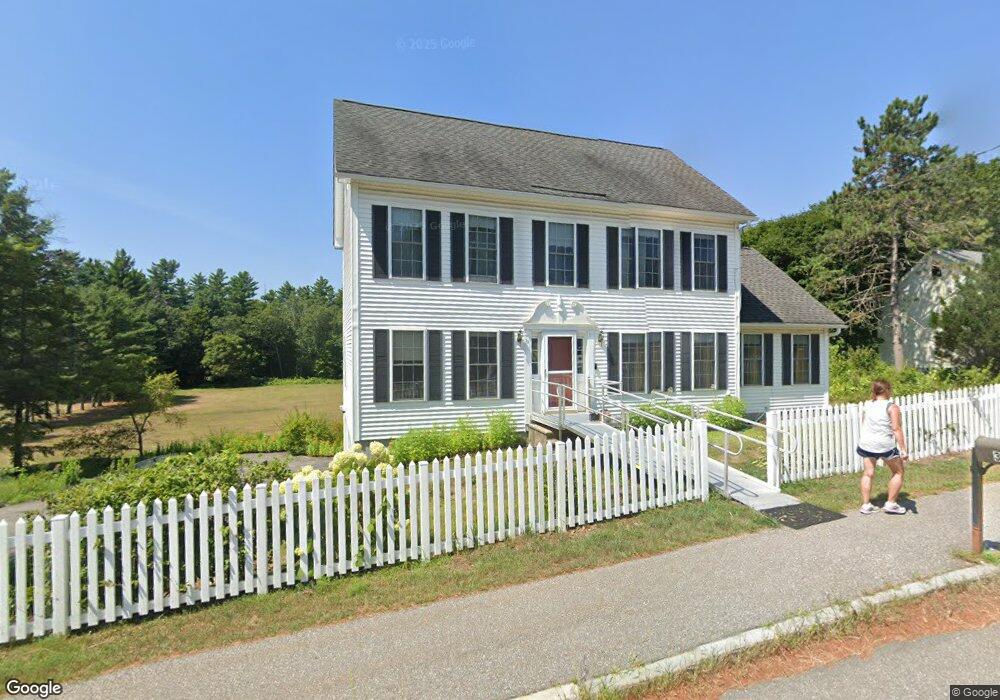
33 Mountain Rd Concord, NH 03301
East Concord NeighborhoodEstimated Value: $567,000 - $626,000
5
Beds
3
Baths
2,103
Sq Ft
$284/Sq Ft
Est. Value
About This Home
This home is located at 33 Mountain Rd, Concord, NH 03301 and is currently estimated at $596,350, approximately $283 per square foot. 33 Mountain Rd is a home located in Merrimack County with nearby schools including Broken Ground School, Rundlett Middle School, and Concord High School.
Ownership History
Date
Name
Owned For
Owner Type
Purchase Details
Closed on
Oct 4, 2005
Sold by
Fuller Channing H and Fuller Susan H
Bought by
Nepal Santosh and Nepal Rajina
Current Estimated Value
Home Financials for this Owner
Home Financials are based on the most recent Mortgage that was taken out on this home.
Original Mortgage
$279,000
Interest Rate
5.84%
Mortgage Type
Purchase Money Mortgage
Create a Home Valuation Report for This Property
The Home Valuation Report is an in-depth analysis detailing your home's value as well as a comparison with similar homes in the area
Home Values in the Area
Average Home Value in this Area
Purchase History
| Date | Buyer | Sale Price | Title Company |
|---|---|---|---|
| Nepal Santosh | $310,000 | -- | |
| Nepal Santosh | $310,000 | -- | |
| Nepal Santosh | $310,000 | -- |
Source: Public Records
Mortgage History
| Date | Status | Borrower | Loan Amount |
|---|---|---|---|
| Open | Nepal Santosh | $175,000 | |
| Closed | Nepal Santosh | $36,000 | |
| Closed | Nepal Santosh | $279,000 |
Source: Public Records
Tax History Compared to Growth
Tax History
| Year | Tax Paid | Tax Assessment Tax Assessment Total Assessment is a certain percentage of the fair market value that is determined by local assessors to be the total taxable value of land and additions on the property. | Land | Improvement |
|---|---|---|---|---|
| 2024 | $10,176 | $367,500 | $143,400 | $224,100 |
| 2023 | $9,876 | $367,700 | $143,400 | $224,300 |
| 2022 | $9,520 | $367,700 | $143,400 | $224,300 |
| 2021 | $9,237 | $367,700 | $143,400 | $224,300 |
| 2020 | $8,617 | $322,000 | $88,500 | $233,500 |
| 2019 | $8,640 | $311,000 | $89,200 | $221,800 |
| 2018 | $8,372 | $297,000 | $89,200 | $207,800 |
| 2017 | $8,051 | $285,100 | $85,900 | $199,200 |
| 2016 | $7,781 | $281,200 | $85,900 | $195,300 |
| 2015 | $7,442 | $263,800 | $85,900 | $177,900 |
| 2014 | $7,072 | $263,800 | $85,900 | $177,900 |
| 2013 | -- | $263,800 | $85,900 | $177,900 |
| 2012 | -- | $259,600 | $81,700 | $177,900 |
Source: Public Records
Map
Nearby Homes
- 2 Shaker Rd
- 61 Mountain Rd
- 11 Eastman St
- 6 Irving Dr
- 282-284 N State St
- 79 Oakmont Dr
- 35 Callaway Dr Unit 2
- 35 Callaway Dr Unit 6
- 3 Palm St
- 6 K St Unit 393Z 104
- 20 Prospect St
- 8-10 Granite Ave
- 4 Venne Cir
- 19 Grappone Dr
- 157 Rumford St
- 30 Jackson St
- 32 E Side Dr
- 17 Burns Ave Unit 2
- Lots 6-11 Sewalls Falls & Abbott Rd
- 0 Sewalls Falls & Abbott Rd Unit Multiple