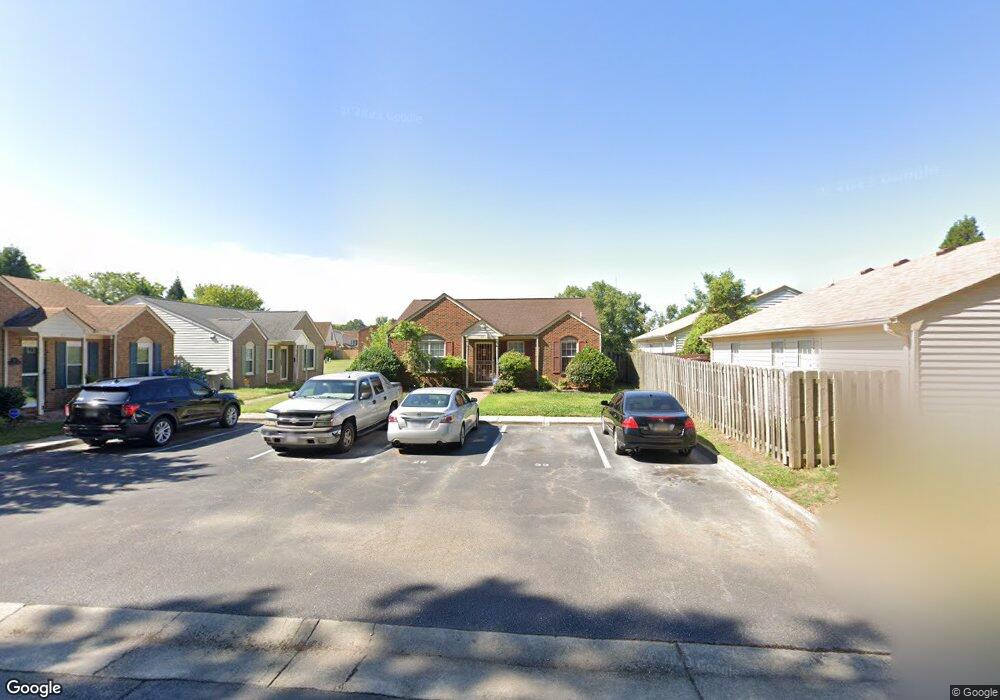
33 N Lake Loop Hampton, VA 23666
Hampton Roads Center NeighborhoodEstimated Value: $249,992 - $263,000
3
Beds
2
Baths
1,149
Sq Ft
$223/Sq Ft
Est. Value
About This Home
This home is located at 33 N Lake Loop, Hampton, VA 23666 and is currently estimated at $256,248, approximately $223 per square foot. 33 N Lake Loop is a home located in Hampton City with nearby schools including George P. Phenix Elementary School, Cesar Tarrant Middle School, and Bethel High School.
Ownership History
Date
Name
Owned For
Owner Type
Purchase Details
Closed on
Mar 13, 2007
Sold by
Rice Holli R
Bought by
Randolph David D
Current Estimated Value
Home Financials for this Owner
Home Financials are based on the most recent Mortgage that was taken out on this home.
Original Mortgage
$175,000
Outstanding Balance
$104,211
Interest Rate
6.33%
Mortgage Type
New Conventional
Estimated Equity
$152,037
Purchase Details
Closed on
Sep 24, 2001
Sold by
Centex Home Equity Corp
Bought by
Morris Joyce
Home Financials for this Owner
Home Financials are based on the most recent Mortgage that was taken out on this home.
Original Mortgage
$74,900
Interest Rate
6.91%
Purchase Details
Closed on
Aug 20, 1999
Sold by
Wickham Robert
Bought by
Lauderdale Brenda J
Home Financials for this Owner
Home Financials are based on the most recent Mortgage that was taken out on this home.
Original Mortgage
$66,725
Interest Rate
7.85%
Create a Home Valuation Report for This Property
The Home Valuation Report is an in-depth analysis detailing your home's value as well as a comparison with similar homes in the area
Home Values in the Area
Average Home Value in this Area
Purchase History
| Date | Buyer | Sale Price | Title Company |
|---|---|---|---|
| Randolph David D | $175,000 | -- | |
| Morris Joyce | $84,900 | -- | |
| Lauderdale Brenda J | $78,500 | -- |
Source: Public Records
Mortgage History
| Date | Status | Borrower | Loan Amount |
|---|---|---|---|
| Open | Randolph David D | $175,000 | |
| Previous Owner | Morris Joyce | $74,900 | |
| Previous Owner | Lauderdale Brenda J | $66,725 |
Source: Public Records
Tax History
| Year | Tax Paid | Tax Assessment Tax Assessment Total Assessment is a certain percentage of the fair market value that is determined by local assessors to be the total taxable value of land and additions on the property. | Land | Improvement |
|---|---|---|---|---|
| 2025 | $2,743 | $231,000 | $55,000 | $176,000 |
| 2024 | $2,558 | $222,400 | $55,000 | $167,400 |
| 2023 | $2,061 | $177,700 | $45,000 | $132,700 |
| 2022 | $1,895 | $160,600 | $40,000 | $120,600 |
| 2021 | $1,894 | $142,300 | $40,000 | $102,300 |
| 2020 | $1,769 | $142,700 | $40,000 | $102,700 |
| 2019 | $1,643 | $132,500 | $40,000 | $92,500 |
| 2018 | $1,664 | $126,600 | $40,000 | $86,600 |
| 2017 | $1,664 | $0 | $0 | $0 |
| 2016 | $1,664 | $126,600 | $0 | $0 |
| 2015 | $1,664 | $0 | $0 | $0 |
| 2014 | $1,871 | $136,000 | $42,800 | $93,200 |
Source: Public Records
Map
Nearby Homes
- 27 Dawn Ln
- 81 N Lake Loop
- 213 Kingwood Dr
- 7 Wild Duck Ct
- 228 Fincastle Dr
- 111 Kincaid Ln
- 41 Sanlun Lakes Dr
- 235 Dublin Ct
- 21 Sanlun Lakes Dr
- 45 Crestwood Dr
- 64 Saunders Rd
- 8 Sanlun Lakes Dr
- 54 Saunders Rd
- 736 Leonard Ln
- 906 Harpersville Rd
- 265 Benns Rd
- 10 Ridgemont Cir
- 33 Tupelo Cir
- 22 Welcome Way
- 684 Harpersville Rd
Your Personal Tour Guide
Ask me questions while you tour the home.