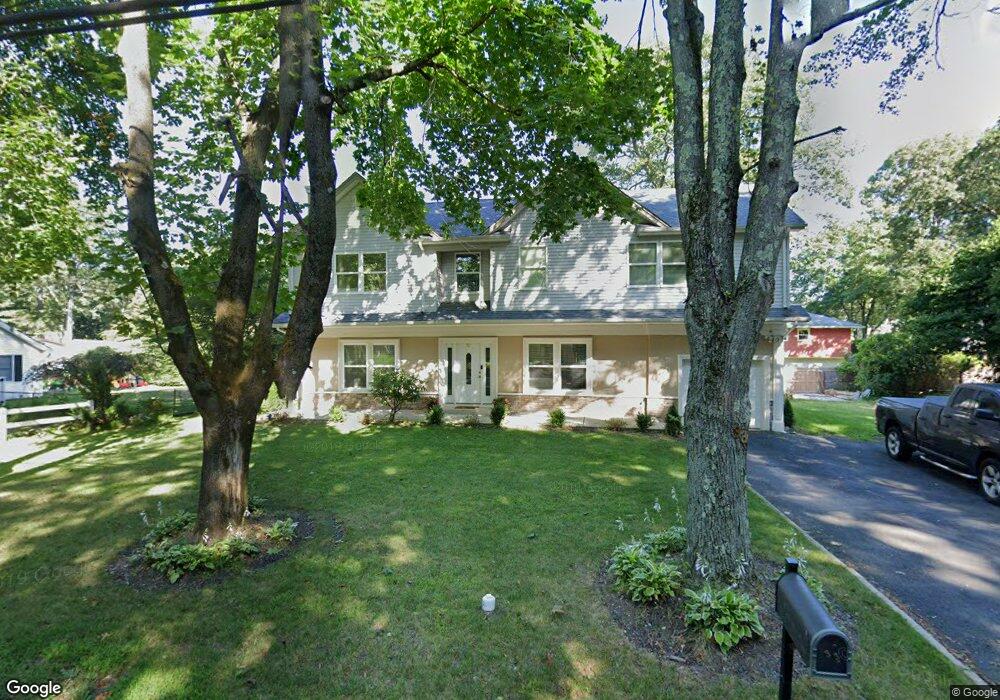
33 Netcong Rd Budd Lake, NJ 07828
Estimated Value: $418,530 - $671,000
Studio
--
Bath
--
Sq Ft
5,009
Sq Ft
About This Home
This home is located at 33 Netcong Rd, Budd Lake, NJ 07828 and is currently estimated at $515,133. 33 Netcong Rd is a home located in Morris County with nearby schools including Mt Olive Middle School and Mount Olive High School.
Ownership History
Date
Name
Owned For
Owner Type
Purchase Details
Closed on
Apr 26, 2019
Sold by
Mesa Juan D and Mesa Wanda
Bought by
Cohen Jesse
Current Estimated Value
Home Financials for this Owner
Home Financials are based on the most recent Mortgage that was taken out on this home.
Original Mortgage
$381,177
Interest Rate
3.7%
Mortgage Type
VA
Purchase Details
Closed on
May 24, 2016
Sold by
Zbigniew Lidwin
Bought by
Mesa Juan and Mesa Jorge
Home Financials for this Owner
Home Financials are based on the most recent Mortgage that was taken out on this home.
Original Mortgage
$333,841
Interest Rate
3.58%
Purchase Details
Closed on
Feb 12, 2015
Sold by
Lidwin Zbigniew and Lidwin Bernadeta
Bought by
Lidwin Bernadeta
Purchase Details
Closed on
Jan 28, 2015
Sold by
Lewis James L and Lewis Nancy A
Bought by
Lidwin Zbigniew and Lidwin Bernadeta
Create a Home Valuation Report for This Property
The Home Valuation Report is an in-depth analysis detailing your home's value as well as a comparison with similar homes in the area
Home Values in the Area
Average Home Value in this Area
Purchase History
| Date | Buyer | Sale Price | Title Company |
|---|---|---|---|
| Cohen Jesse | $369,000 | Key Settlements Inc | |
| Mesa Juan | -- | -- | |
| Lidwin Bernadeta | -- | Nrt Title Agency Llc | |
| Lidwin Zbigniew | $110,000 | Nrt Title Agency Llc |
Source: Public Records
Mortgage History
| Date | Status | Borrower | Loan Amount |
|---|---|---|---|
| Previous Owner | Cohen Jesse | $381,177 | |
| Previous Owner | Mesa Juan | $333,841 | |
| Previous Owner | Mesa Juan | -- |
Source: Public Records
Tax History
| Year | Tax Paid | Tax Assessment Tax Assessment Total Assessment is a certain percentage of the fair market value that is determined by local assessors to be the total taxable value of land and additions on the property. | Land | Improvement |
|---|---|---|---|---|
| 2025 | $268 | $7,700 | $5,600 | $2,100 |
| 2024 | $253 | $7,700 | $5,600 | $2,100 |
Source: Public Records
Map
Nearby Homes
Your Personal Tour Guide
Ask me questions while you tour the home.