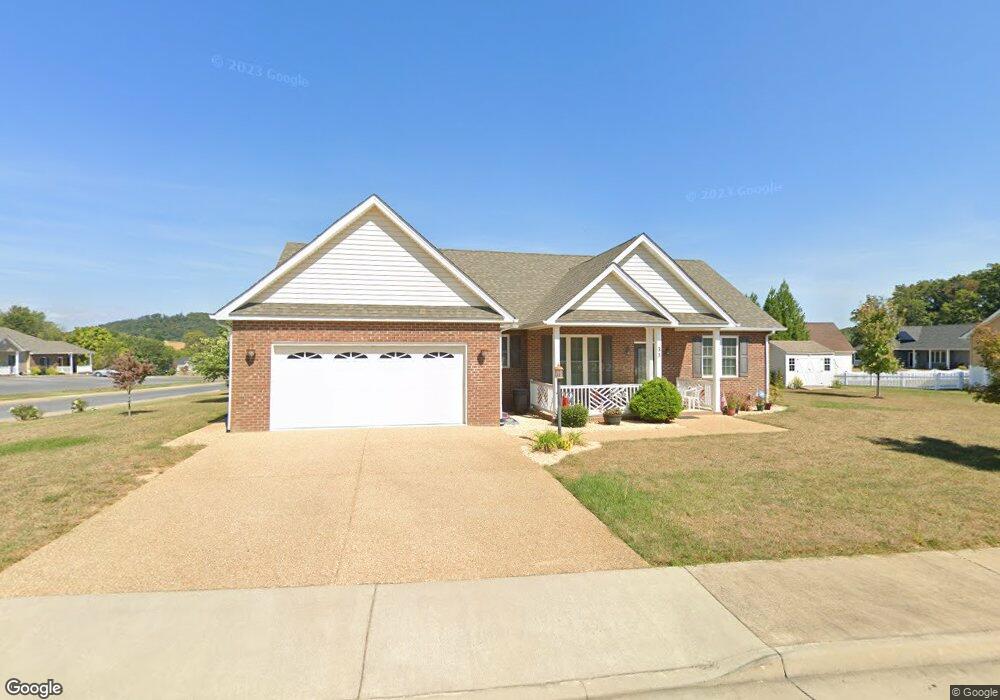
33 Old Oak Dr Stuarts Draft, VA 24477
Estimated Value: $421,851 - $441,000
3
Beds
2
Baths
1,898
Sq Ft
$228/Sq Ft
Est. Value
About This Home
This home is located at 33 Old Oak Dr, Stuarts Draft, VA 24477 and is currently estimated at $433,213, approximately $228 per square foot. 33 Old Oak Dr is a home located in Augusta County with nearby schools including Stuarts Draft Elementary School, Stuarts Draft Middle School, and Stuarts Draft High School.
Ownership History
Date
Name
Owned For
Owner Type
Purchase Details
Closed on
Dec 1, 2021
Sold by
Gayer Robert
Bought by
Sweet Daniel S and Sweet Cynthia C
Current Estimated Value
Home Financials for this Owner
Home Financials are based on the most recent Mortgage that was taken out on this home.
Original Mortgage
$259,000
Outstanding Balance
$237,535
Interest Rate
2.9%
Mortgage Type
Purchase Money Mortgage
Estimated Equity
$195,678
Purchase Details
Closed on
Nov 4, 2021
Sold by
Robert Gayer
Bought by
Sweet Daniel S and Sweet Cynthia C
Home Financials for this Owner
Home Financials are based on the most recent Mortgage that was taken out on this home.
Original Mortgage
$259,000
Outstanding Balance
$237,535
Interest Rate
2.9%
Mortgage Type
Purchase Money Mortgage
Estimated Equity
$195,678
Purchase Details
Closed on
Aug 1, 2019
Sold by
Shiflett Della S
Bought by
Gayer Robert and Gayer Elizabeth M
Create a Home Valuation Report for This Property
The Home Valuation Report is an in-depth analysis detailing your home's value as well as a comparison with similar homes in the area
Purchase History
| Date | Buyer | Sale Price | Title Company |
|---|---|---|---|
| Sweet Daniel S | $329,000 | None Available | |
| Sweet Daniel S | $329,000 | None Listed On Document | |
| Gayer Robert | $285,000 | Alliance Title |
Source: Public Records
Mortgage History
| Date | Status | Borrower | Loan Amount |
|---|---|---|---|
| Open | Sweet Daniel S | $259,000 | |
| Closed | Sweet Daniel S | $259,000 |
Source: Public Records
Tax History
| Year | Tax Paid | Tax Assessment Tax Assessment Total Assessment is a certain percentage of the fair market value that is determined by local assessors to be the total taxable value of land and additions on the property. | Land | Improvement |
|---|---|---|---|---|
| 2025 | $2,045 | $393,300 | $65,000 | $328,300 |
| 2024 | $2,080 | $400,000 | $65,000 | $335,000 |
| 2023 | $1,565 | $248,400 | $50,000 | $198,400 |
| 2022 | $1,565 | $248,400 | $50,000 | $198,400 |
| 2021 | $1,565 | $248,400 | $50,000 | $198,400 |
| 2020 | $1,565 | $248,400 | $50,000 | $198,400 |
| 2019 | $1,565 | $248,400 | $50,000 | $198,400 |
| 2018 | $1,415 | $224,633 | $50,000 | $174,633 |
| 2017 | $1,303 | $224,633 | $50,000 | $174,633 |
| 2016 | $1,303 | $224,633 | $50,000 | $174,633 |
| 2015 | -- | $224,633 | $50,000 | $174,633 |
| 2014 | -- | $224,633 | $50,000 | $174,633 |
| 2013 | -- | $40,000 | $40,000 | $0 |
Source: Public Records
Map
Nearby Homes
- 62 Fossil Dr
- 68 Fossil Dr
- 66 Fossil Dr
- 162 Locust Grove Ln
- 3318 Stuarts Draft Hwy
- 42 Lynn Cir
- 81 Meriwether Cir
- 2735 Stuarts Draft Hwy
- 634 Augusta Farms Rd
- 153 Sylvan Dr
- 490 Kindig Rd
- 00 Lipscomb Rd
- 96 Shalom Rd
- 0 Johnson Dr Unit 663189
- 157 Lookover Terrace
- 98 Rebecca Ct
- 86 Lookover Terrace
- 14 Lookover Terrace
- 117 Spring Ridge Dr
- 122 Spring Ridge Dr
Your Personal Tour Guide
Ask me questions while you tour the home.