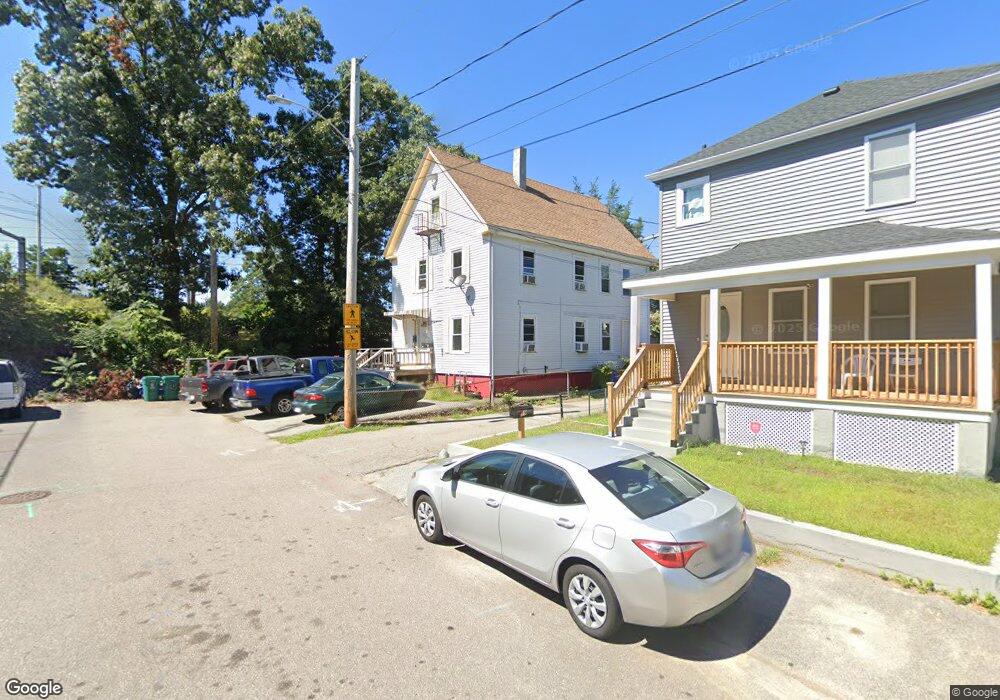
33 Olive St Attleboro, MA 02703
Estimated Value: $449,000 - $692,000
5
Beds
3
Baths
6,100
Sq Ft
$90/Sq Ft
Est. Value
About This Home
This home is located at 33 Olive St, Attleboro, MA 02703 and is currently estimated at $547,667, approximately $89 per square foot. 33 Olive St is a home located in Bristol County with nearby schools including Peter Thacher Elementary School, Cyril K. Brennan Middle School, and Attleboro High School.
Ownership History
Date
Name
Owned For
Owner Type
Purchase Details
Closed on
Aug 28, 2008
Sold by
Hsbc Bank Usa
Bought by
Odonnell John J
Current Estimated Value
Purchase Details
Closed on
Mar 2, 2005
Sold by
Lehman Donna H
Bought by
Lehman Donna and Lehman Donald
Purchase Details
Closed on
Oct 31, 1997
Sold by
Gullicksen Denise L
Bought by
Lehman Donna H
Home Financials for this Owner
Home Financials are based on the most recent Mortgage that was taken out on this home.
Original Mortgage
$94,000
Interest Rate
7.31%
Mortgage Type
Purchase Money Mortgage
Create a Home Valuation Report for This Property
The Home Valuation Report is an in-depth analysis detailing your home's value as well as a comparison with similar homes in the area
Home Values in the Area
Average Home Value in this Area
Purchase History
| Date | Buyer | Sale Price | Title Company |
|---|---|---|---|
| Odonnell John J | $54,000 | -- | |
| Odonnell John J | $54,000 | -- | |
| Odonnell John J | $54,000 | -- | |
| Lehman Donna | -- | -- | |
| Lehman Donna H | $99,000 | -- | |
| Lehman Donna H | $99,000 | -- |
Source: Public Records
Mortgage History
| Date | Status | Borrower | Loan Amount |
|---|---|---|---|
| Previous Owner | Lehman Donna H | $94,000 |
Source: Public Records
Tax History
| Year | Tax Paid | Tax Assessment Tax Assessment Total Assessment is a certain percentage of the fair market value that is determined by local assessors to be the total taxable value of land and additions on the property. | Land | Improvement |
|---|---|---|---|---|
| 2025 | $4,145 | $330,300 | $112,700 | $217,600 |
| 2024 | $4,048 | $318,000 | $112,700 | $205,300 |
| 2023 | $3,657 | $267,100 | $102,400 | $164,700 |
| 2022 | $3,402 | $235,400 | $97,600 | $137,800 |
| 2021 | $3,127 | $223,300 | $93,800 | $129,500 |
| 2020 | $3,111 | $213,700 | $91,000 | $122,700 |
| 2019 | $2,957 | $208,800 | $89,300 | $119,500 |
| 2018 | $2,761 | $186,300 | $86,700 | $99,600 |
| 2017 | $2,741 | $188,400 | $86,700 | $101,700 |
| 2016 | $2,462 | $166,100 | $77,000 | $89,100 |
| 2015 | $2,339 | $159,000 | $77,000 | $82,000 |
| 2014 | $2,171 | $146,200 | $72,900 | $73,300 |
Source: Public Records
Map
Nearby Homes
- 3 Robert St
- 70 Riverside Ave
- 61 Pine St Unit 7
- 75 Dennis St Unit 3
- 36 Hazel St
- 91 East St
- 64 Mechanic St Unit 3
- 64 Mechanic St
- 0 Rosedale Ln Unit 73469293
- 28 Pine St Unit C
- 366 Thacher St Unit 6
- 1 Bellmore St
- 5 Foster St
- 142 Fisher St Unit B
- 142 Fisher St Unit A
- 126 Linden St Unit A
- 10 John St
- 5 Hope St
- 567 Park St
- 0 Joseph St Unit 73469304
- 33 Olive St Unit 3
- 33 Olive St Unit 1
- 0 Garden St
- 3 Eden Ct
- 29 Olive St
- 27 Olive St
- 7 Eden Ct
- 63 Garden St
- 31 Olive St Unit 2
- 31 Olive St Unit 1
- 31 Olive St Unit 3
- 31 Olive St
- 31 Olive St Unit 1st floor
- 62 Garden St Unit 4
- 62 Garden St Unit 2
- 62 Garden St Unit 1
- 62 Garden St Unit 62
- 62 Garden St
- 105 Olive St
- 21 Olive St
Your Personal Tour Guide
Ask me questions while you tour the home.