33 Pine St Sandwich, MA 02563
Estimated Value: $601,000 - $744,000
3
Beds
2
Baths
1,732
Sq Ft
$385/Sq Ft
Est. Value
About This Home
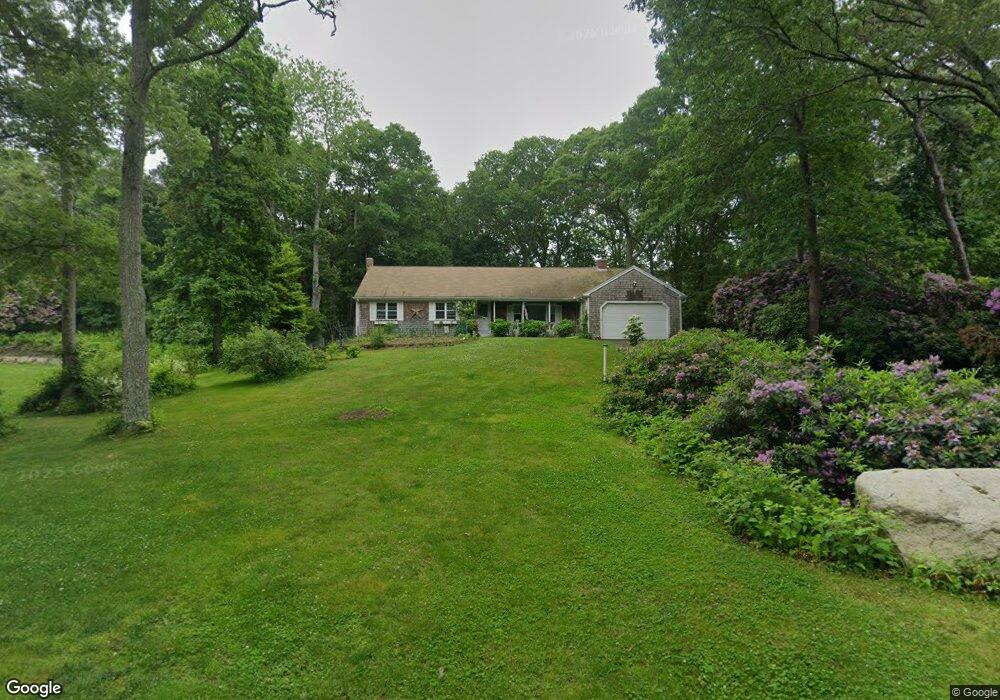
This home is located at 33 Pine St, Sandwich, MA 02563 and is currently estimated at $666,524, approximately $384 per square foot. 33 Pine St is a home located in Barnstable County with nearby schools including Sandwich Middle High School, Waldorf School of Cape Cod, and Bridgeview Montessori School.
Ownership History
Date
Name
Owned For
Owner Type
Purchase Details
Closed on
Aug 25, 2020
Sold by
Sweet Janes Consignment
Bought by
Sweet Janes Consignment
Current Estimated Value
Purchase Details
Closed on
Jul 10, 2020
Sold by
Wells Fargo Bank Na Tr
Bought by
Sweet Janes Consignment
Purchase Details
Closed on
Jul 10, 2018
Sold by
Young Susan K and Wells Fargo Bank Na
Bought by
Wells Fargo Bank Na Tr
Purchase Details
Closed on
Jun 22, 2001
Sold by
Rawding Doloris V and Pfaunz Rudolph
Bought by
Oconnell Terrance P
Create a Home Valuation Report for This Property
The Home Valuation Report is an in-depth analysis detailing your home's value as well as a comparison with similar homes in the area
Home Values in the Area
Average Home Value in this Area
Purchase History
| Date | Buyer | Sale Price | Title Company |
|---|---|---|---|
| Sweet Janes Consignment | -- | None Available | |
| Sweet Janes Consignment | -- | None Available | |
| Sweet Janes Consignment | $423,125 | None Available | |
| Wells Fargo Bank Na Tr | $371,000 | -- | |
| Oconnell Terrance P | $245,000 | -- | |
| Wells Fargo Bank Na Tr | $371,000 | -- | |
| Oconnell Terrance P | $245,000 | -- |
Source: Public Records
Mortgage History
| Date | Status | Borrower | Loan Amount |
|---|---|---|---|
| Previous Owner | Oconnell Terrance P | $285,000 | |
| Previous Owner | Oconnell Terrance P | $240,000 | |
| Previous Owner | Oconnell Terrance P | $225,000 |
Source: Public Records
Tax History Compared to Growth
Tax History
| Year | Tax Paid | Tax Assessment Tax Assessment Total Assessment is a certain percentage of the fair market value that is determined by local assessors to be the total taxable value of land and additions on the property. | Land | Improvement |
|---|---|---|---|---|
| 2025 | $5,604 | $530,200 | $190,600 | $339,600 |
| 2024 | $5,300 | $490,700 | $170,200 | $320,500 |
| 2023 | $5,183 | $450,700 | $154,800 | $295,900 |
| 2022 | $4,713 | $358,100 | $119,300 | $238,800 |
| 2021 | $4,510 | $327,500 | $114,700 | $212,800 |
| 2020 | $18,184 | $320,000 | $118,000 | $202,000 |
| 2019 | $4,446 | $310,500 | $121,600 | $188,900 |
| 2018 | $18,265 | $287,500 | $111,800 | $175,700 |
| 2017 | $17,786 | $288,700 | $124,500 | $164,200 |
| 2016 | $4,043 | $279,400 | $120,000 | $159,400 |
| 2015 | $3,930 | $265,200 | $111,000 | $154,200 |
Source: Public Records
Map
Nearby Homes