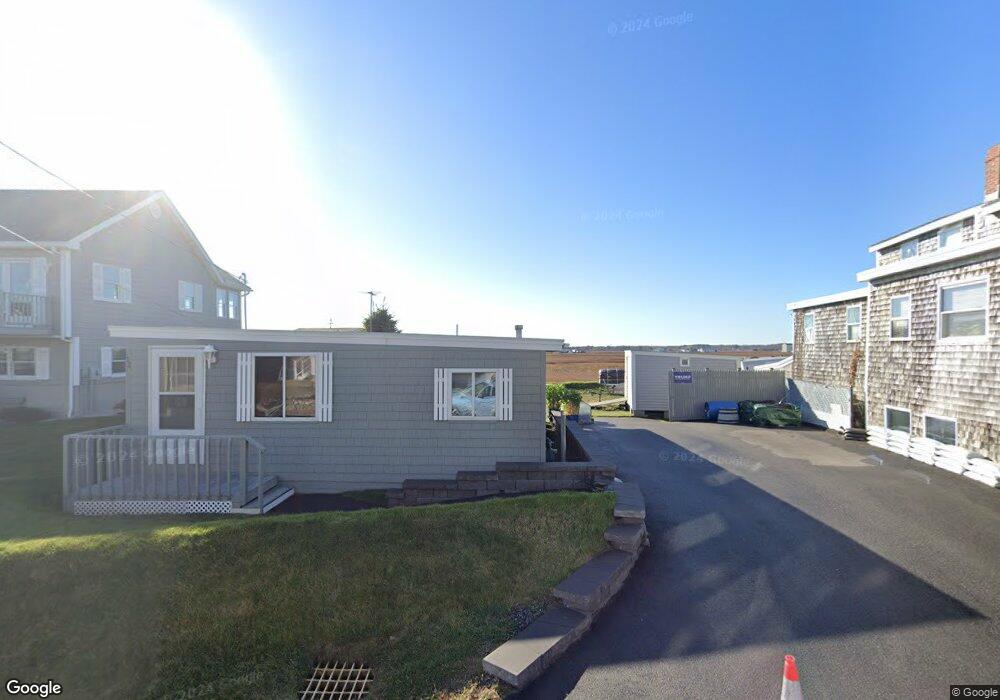
33 River St Seabrook, NH 03874
Seabrook Beach NeighborhoodEstimated Value: $425,569 - $742,000
1
Bed
1
Bath
640
Sq Ft
$1,013/Sq Ft
Est. Value
About This Home
This home is located at 33 River St, Seabrook, NH 03874 and is currently estimated at $648,392, approximately $1,013 per square foot. 33 River St is a home located in Rockingham County with nearby schools including Seabrook Elementary School, Seabrook Middle School, and Winnacunnet High School.
Ownership History
Date
Name
Owned For
Owner Type
Purchase Details
Closed on
Aug 1, 2019
Sold by
Wright David C and Wright Charles
Bought by
Wright David C
Current Estimated Value
Purchase Details
Closed on
Oct 29, 2018
Sold by
Wright David
Bought by
Wright David C and Wight Charles
Purchase Details
Closed on
Mar 27, 1998
Sold by
Wright Charles B and Wright Mary E
Bought by
Wright David C
Home Financials for this Owner
Home Financials are based on the most recent Mortgage that was taken out on this home.
Original Mortgage
$54,000
Interest Rate
6.96%
Mortgage Type
Purchase Money Mortgage
Create a Home Valuation Report for This Property
The Home Valuation Report is an in-depth analysis detailing your home's value as well as a comparison with similar homes in the area
Home Values in the Area
Average Home Value in this Area
Purchase History
| Date | Buyer | Sale Price | Title Company |
|---|---|---|---|
| Wright David C | -- | -- | |
| Wright David C | -- | -- | |
| Wright David C | $50,000 | -- |
Source: Public Records
Mortgage History
| Date | Status | Borrower | Loan Amount |
|---|---|---|---|
| Previous Owner | Wright David C | $20,000 | |
| Previous Owner | Wright David C | $54,000 |
Source: Public Records
Tax History
| Year | Tax Paid | Tax Assessment Tax Assessment Total Assessment is a certain percentage of the fair market value that is determined by local assessors to be the total taxable value of land and additions on the property. | Land | Improvement |
|---|---|---|---|---|
| 2024 | $4,658 | $397,400 | $305,300 | $92,100 |
| 2023 | $4,741 | $314,200 | $229,400 | $84,800 |
| 2022 | $4,163 | $314,200 | $229,400 | $84,800 |
| 2021 | $4,314 | $314,200 | $229,400 | $84,800 |
| 2020 | $5,248 | $252,400 | $184,500 | $67,900 |
| 2019 | $6,275 | $250,400 | $182,500 | $67,900 |
| 2018 | $3,794 | $233,500 | $165,600 | $67,900 |
| 2017 | $2,988 | $183,900 | $116,000 | $67,900 |
| 2016 | $4,608 | $184,100 | $116,000 | $68,100 |
| 2015 | $2,384 | $161,200 | $108,500 | $52,700 |
| 2014 | $2,462 | $161,200 | $108,500 | $52,700 |
| 2013 | $2,462 | $161,200 | $108,500 | $52,700 |
Source: Public Records
Map
Nearby Homes
- 23 River St
- 376 Ocean Blvd
- 3 Tyngsboro St
- 9 Tyngsboro St
- 27 Cross Beach Rd
- 108 Ocean Dr Unit 1
- 20 Campton St
- 8 Portsmouth Ave
- 308 State Route 286 Unit Lot 73
- 308 State Route 286 Unit Lot 108
- 308 State Route 286 Unit Lot 23
- 308 State Route 286 Unit Lot 87
- 3 Harris Ave
- 169 Ashworth Ave
- 19 Riverview Terrace
- 308 Route 286 Unit Lot 58
- 10 Haverhill Ave Unit 1
- 10 Haverhill Ave Unit 2
- 42 Commonwealth Ave
- 3 Perkins Ave Unit 1
Your Personal Tour Guide
Ask me questions while you tour the home.