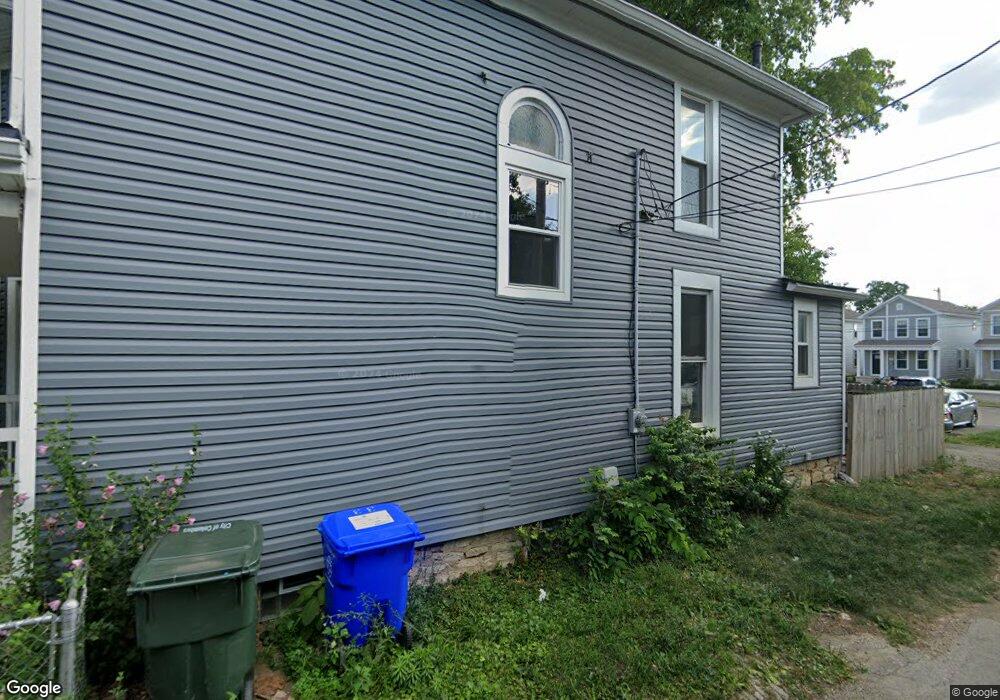
33 S Souder Ave Columbus, OH 43222
Franklinton NeighborhoodEstimated Value: $269,000 - $329,000
3
Beds
2
Baths
2,146
Sq Ft
$137/Sq Ft
Est. Value
About This Home
This home is located at 33 S Souder Ave, Columbus, OH 43222 and is currently estimated at $294,474, approximately $137 per square foot. 33 S Souder Ave is a home located in Franklin County with nearby schools including Avondale Elementary School, Starling PK-8, and West High School.
Ownership History
Date
Name
Owned For
Owner Type
Purchase Details
Closed on
Jun 1, 2022
Sold by
Geoffrey Shoupp
Bought by
Shoupp Geoffrey
Current Estimated Value
Home Financials for this Owner
Home Financials are based on the most recent Mortgage that was taken out on this home.
Original Mortgage
$225,758
Outstanding Balance
$213,639
Interest Rate
5.3%
Mortgage Type
New Conventional
Estimated Equity
$80,835
Purchase Details
Closed on
Oct 27, 2021
Sold by
Main Street America Ltd
Bought by
Shoupp Geoffrey and Gennaoui Abigail R
Home Financials for this Owner
Home Financials are based on the most recent Mortgage that was taken out on this home.
Original Mortgage
$223,100
Interest Rate
2.88%
Mortgage Type
New Conventional
Purchase Details
Closed on
Jan 22, 2018
Sold by
Mechenbier James A
Bought by
Main Street America Ltd
Purchase Details
Closed on
Jun 15, 1992
Bought by
Mechenbier James A
Create a Home Valuation Report for This Property
The Home Valuation Report is an in-depth analysis detailing your home's value as well as a comparison with similar homes in the area
Home Values in the Area
Average Home Value in this Area
Purchase History
| Date | Buyer | Sale Price | Title Company |
|---|---|---|---|
| Shoupp Geoffrey | $60,000 | Search2close | |
| Shoupp Geoffrey | $230,000 | World Class Title | |
| Main Street America Ltd | $10,000 | Chicago Title | |
| Mechenbier James A | $30,000 | -- |
Source: Public Records
Mortgage History
| Date | Status | Borrower | Loan Amount |
|---|---|---|---|
| Open | Shoupp Geoffrey | $225,758 | |
| Previous Owner | Shoupp Geoffrey | $223,100 |
Source: Public Records
Tax History
| Year | Tax Paid | Tax Assessment Tax Assessment Total Assessment is a certain percentage of the fair market value that is determined by local assessors to be the total taxable value of land and additions on the property. | Land | Improvement |
|---|---|---|---|---|
| 2025 | $5,127 | $114,250 | $5,570 | $108,680 |
| 2024 | $5,127 | $114,250 | $5,570 | $108,680 |
| 2023 | $4,656 | $114,240 | $5,565 | $108,675 |
| 2022 | $3,577 | $68,960 | $1,090 | $67,870 |
| 2021 | $2,236 | $42,000 | $9,870 | $32,130 |
| 2020 | $1,376 | $25,800 | $9,870 | $15,930 |
| 2019 | $1,395 | $22,440 | $8,580 | $13,860 |
| 2018 | $1,264 | $22,440 | $8,580 | $13,860 |
| 2017 | $1,395 | $22,440 | $8,580 | $13,860 |
| 2016 | $1,401 | $20,620 | $8,580 | $12,040 |
| 2015 | $1,275 | $20,620 | $8,580 | $12,040 |
| 2014 | $1,279 | $20,620 | $8,580 | $12,040 |
| 2013 | $694 | $20,615 | $8,575 | $12,040 |
Source: Public Records
Map
Nearby Homes
- 45 S Hartford Ave
- 49 S Hartford Ave
- 45 N Hartford Ave
- 43 N Jones Ave
- 194 S Souder Ave
- 0 S Green St
- 186 Avondale Ave Unit 188
- 69 Rodgers Ave
- 34 S Cypress Ave
- 1020-1026 Cable Ave
- 41 S Cypress Ave
- 83 S Cypress Ave
- 235-237 Avondale Ave
- 149 S Cypress Ave
- 211 Dakota Ave
- 273 Avondale Ave
- 753 1/2 Sullivant Ave
- 262 S Cypress Ave
- 550 W Town St
- 546 W Town St
- 35 S Souder Ave
- 847 W Broad St
- 839 W Broad St
- 33 S Hartford Ave
- 37 S Hartford Ave
- 844 W Broad St
- 34 Martin Ave Columbus
- 34 Martin Ave
- 30 Martin Ave
- 30 Martin Ave Unit B
- 36 Martin Ave
- 44 Martin Ave
- 866 W Broad St
- 50 Martin Ave
- 40 Martin Ave
- 54 Martin Ave
- 891 W Broad St
- 60 Martin Ave Unit 60
- 62 Martin Ave
- 70 Martin Ave
Your Personal Tour Guide
Ask me questions while you tour the home.