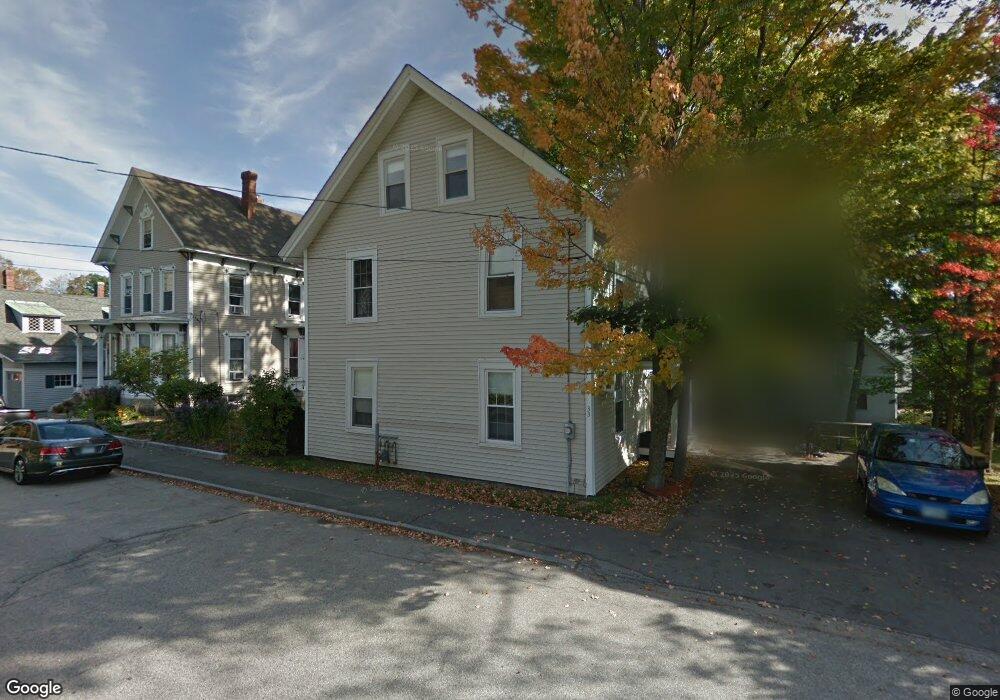
33 S Spring St Concord, NH 03301
South End NeighborhoodEstimated Value: $459,000 - $605,000
4
Beds
2
Baths
2,412
Sq Ft
$226/Sq Ft
Est. Value
About This Home
This home is located at 33 S Spring St, Concord, NH 03301 and is currently estimated at $545,167, approximately $226 per square foot. 33 S Spring St is a home located in Merrimack County with nearby schools including Christa McAuliffe School, Rundlett Middle School, and Concord High School.
Ownership History
Date
Name
Owned For
Owner Type
Purchase Details
Closed on
Sep 14, 2017
Sold by
Drewes James
Bought by
Drewes Shari L
Current Estimated Value
Purchase Details
Closed on
Feb 22, 2000
Sold by
33 S Spring St Llc
Bought by
Drewes James F and Drewes Shari L
Home Financials for this Owner
Home Financials are based on the most recent Mortgage that was taken out on this home.
Original Mortgage
$106,000
Interest Rate
8.11%
Mortgage Type
Purchase Money Mortgage
Purchase Details
Closed on
May 28, 1999
Sold by
Perkins Est Marlene
Bought by
33 South Spring St Llc
Home Financials for this Owner
Home Financials are based on the most recent Mortgage that was taken out on this home.
Original Mortgage
$82,950
Interest Rate
6.82%
Mortgage Type
Purchase Money Mortgage
Create a Home Valuation Report for This Property
The Home Valuation Report is an in-depth analysis detailing your home's value as well as a comparison with similar homes in the area
Home Values in the Area
Average Home Value in this Area
Purchase History
| Date | Buyer | Sale Price | Title Company |
|---|---|---|---|
| Drewes Shari L | -- | -- | |
| Drewes James F | $116,000 | -- | |
| 33 South Spring St Llc | $56,000 | -- |
Source: Public Records
Mortgage History
| Date | Status | Borrower | Loan Amount |
|---|---|---|---|
| Previous Owner | 33 South Spring St Llc | $75,000 | |
| Previous Owner | 33 South Spring St Llc | $106,000 | |
| Previous Owner | 33 South Spring St Llc | $82,950 |
Source: Public Records
Tax History
| Year | Tax Paid | Tax Assessment Tax Assessment Total Assessment is a certain percentage of the fair market value that is determined by local assessors to be the total taxable value of land and additions on the property. | Land | Improvement |
|---|---|---|---|---|
| 2025 | $10,608 | $364,400 | $89,900 | $274,500 |
| 2024 | $10,018 | $361,800 | $89,900 | $271,900 |
| 2023 | $9,718 | $361,800 | $89,900 | $271,900 |
| 2022 | $9,367 | $361,800 | $89,900 | $271,900 |
| 2021 | $8,892 | $354,000 | $89,900 | $264,100 |
| 2020 | $8,178 | $305,600 | $71,800 | $233,800 |
| 2019 | $7,884 | $283,800 | $66,700 | $217,100 |
| 2018 | $1,076 | $263,900 | $66,700 | $197,200 |
| 2017 | $6,490 | $229,800 | $66,700 | $163,100 |
| 2016 | $6,170 | $223,000 | $66,700 | $156,300 |
| 2015 | $5,758 | $212,600 | $65,400 | $147,200 |
| 2014 | $5,700 | $212,600 | $65,400 | $147,200 |
| 2013 | -- | $211,000 | $65,400 | $145,600 |
| 2012 | -- | $209,800 | $65,400 | $144,400 |
Source: Public Records
Map
Nearby Homes
- 31 S Spring St
- 35 S Spring St
- 35 S Spring St Unit 2
- 37 S Spring St
- 29 S Spring St
- 60 Concord St
- 32 South St
- 32 & 38 South St
- 27 N Spring St
- 27 S Spring St
- 30 South St
- 30 South St Unit 2
- 114 St
- 20 N Spring St Unit 4
- 20 N Spring St Unit 1
- 20 S Spring St
- 34 South St
- 28 South St
- 22 S Spring St
- 39 S Spring St
Your Personal Tour Guide
Ask me questions while you tour the home.