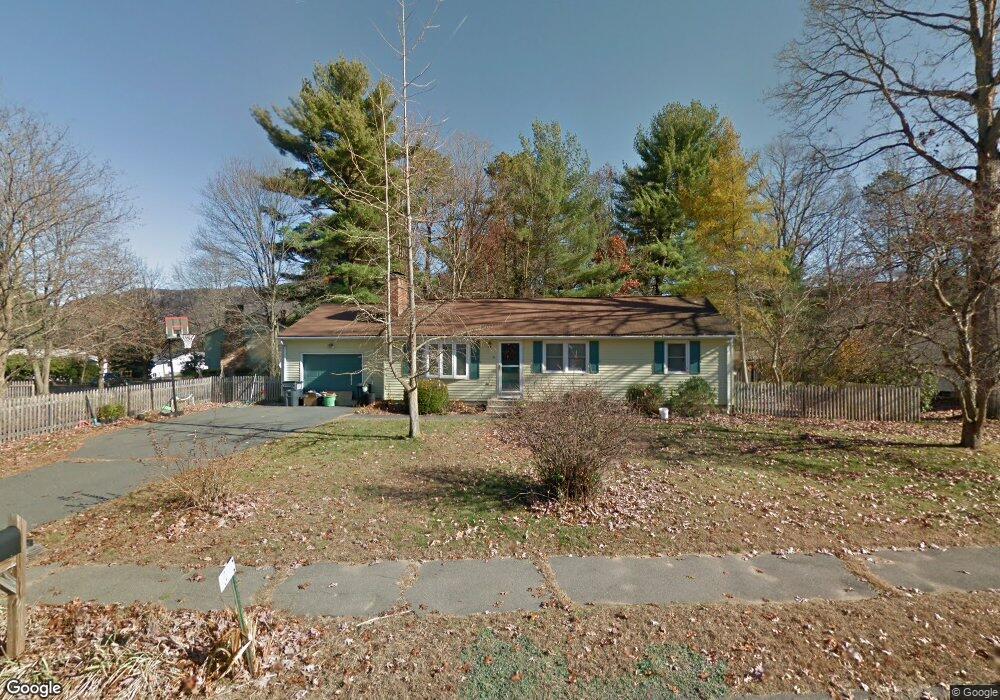
33 Sandra Rd Easthampton, MA 01027
Estimated Value: $372,000 - $457,000
3
Beds
1
Bath
1,188
Sq Ft
$340/Sq Ft
Est. Value
About This Home
This home is located at 33 Sandra Rd, Easthampton, MA 01027 and is currently estimated at $403,905, approximately $339 per square foot. 33 Sandra Rd is a home located in Hampshire County with nearby schools including Easthampton High School, Calvary Baptist Christian School, and Tri-County Schools.
Ownership History
Date
Name
Owned For
Owner Type
Purchase Details
Closed on
Oct 22, 2010
Sold by
Lis John S
Bought by
Brynjolfsson Amanda K and Moody Nelle A
Current Estimated Value
Home Financials for this Owner
Home Financials are based on the most recent Mortgage that was taken out on this home.
Original Mortgage
$148,000
Outstanding Balance
$97,764
Interest Rate
4.37%
Mortgage Type
Purchase Money Mortgage
Estimated Equity
$306,141
Create a Home Valuation Report for This Property
The Home Valuation Report is an in-depth analysis detailing your home's value as well as a comparison with similar homes in the area
Home Values in the Area
Average Home Value in this Area
Purchase History
| Date | Buyer | Sale Price | Title Company |
|---|---|---|---|
| Brynjolfsson Amanda K | $185,000 | -- |
Source: Public Records
Mortgage History
| Date | Status | Borrower | Loan Amount |
|---|---|---|---|
| Open | Brynjolfsson Amanda K | $148,000 |
Source: Public Records
Tax History
| Year | Tax Paid | Tax Assessment Tax Assessment Total Assessment is a certain percentage of the fair market value that is determined by local assessors to be the total taxable value of land and additions on the property. | Land | Improvement |
|---|---|---|---|---|
| 2025 | $4,835 | $353,700 | $120,700 | $233,000 |
| 2024 | $4,666 | $344,100 | $117,200 | $226,900 |
| 2023 | $3,819 | $260,700 | $92,200 | $168,500 |
| 2022 | $4,309 | $260,700 | $92,200 | $168,500 |
| 2021 | $4,722 | $269,200 | $92,200 | $177,000 |
| 2020 | $4,630 | $260,700 | $92,200 | $168,500 |
| 2019 | $3,873 | $250,500 | $92,200 | $158,300 |
| 2018 | $3,704 | $231,500 | $86,900 | $144,600 |
| 2017 | $3,615 | $223,000 | $83,500 | $139,500 |
| 2016 | $3,477 | $223,000 | $83,500 | $139,500 |
| 2015 | $3,378 | $223,000 | $83,500 | $139,500 |
Source: Public Records
Map
Nearby Homes
Your Personal Tour Guide
Ask me questions while you tour the home.