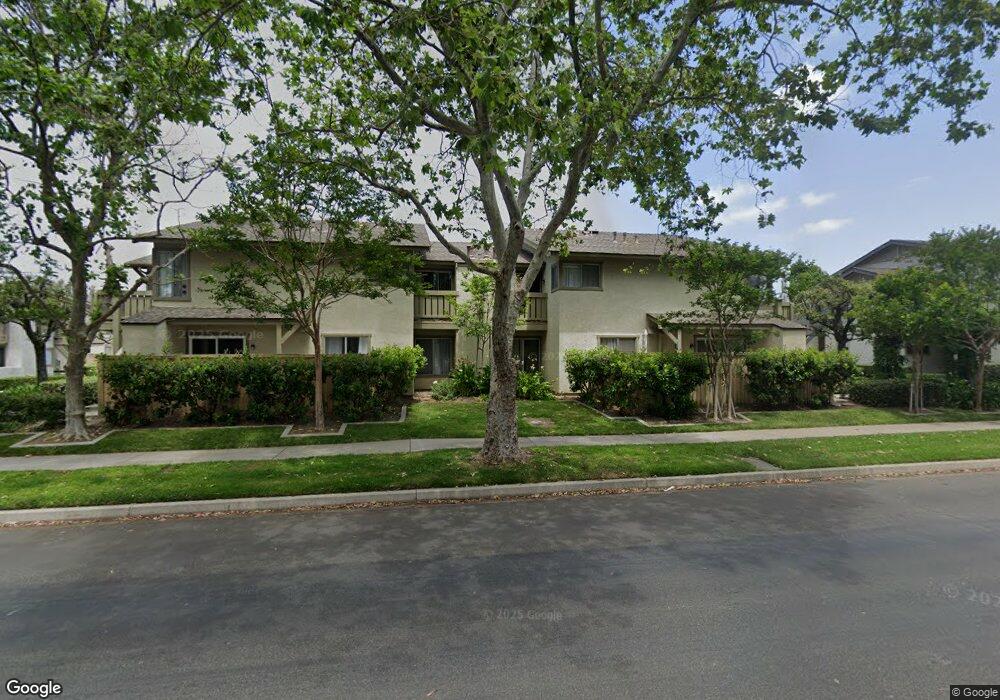
33 Smokestone Unit 35 Irvine, CA 92614
Woodbridge NeighborhoodEstimated Value: $702,000 - $999,000
3
Beds
2
Baths
1,170
Sq Ft
$700/Sq Ft
Est. Value
About This Home
This home is located at 33 Smokestone Unit 35, Irvine, CA 92614 and is currently estimated at $818,700, approximately $699 per square foot. 33 Smokestone Unit 35 is a home located in Orange County with nearby schools including Meadow Park School, South Lake Middle School, and Woodbridge High School.
Ownership History
Date
Name
Owned For
Owner Type
Purchase Details
Closed on
Jan 5, 2011
Sold by
Hadley Thomas Allan and Hadley Oril Sarurai
Bought by
Hadley Thomas A and Hadley Oril S
Current Estimated Value
Home Financials for this Owner
Home Financials are based on the most recent Mortgage that was taken out on this home.
Original Mortgage
$325,350
Outstanding Balance
$218,068
Interest Rate
4.43%
Mortgage Type
VA
Estimated Equity
$600,632
Purchase Details
Closed on
Feb 26, 2001
Sold by
Taylor Lawrence G
Bought by
Hadley Thomas Allan and Hadley Oril Sarurai
Home Financials for this Owner
Home Financials are based on the most recent Mortgage that was taken out on this home.
Original Mortgage
$195,840
Interest Rate
6.98%
Mortgage Type
VA
Create a Home Valuation Report for This Property
The Home Valuation Report is an in-depth analysis detailing your home's value as well as a comparison with similar homes in the area
Home Values in the Area
Average Home Value in this Area
Purchase History
| Date | Buyer | Sale Price | Title Company |
|---|---|---|---|
| Hadley Thomas A | -- | First American Title Company | |
| Hadley Thomas Allan | $192,000 | Old Republic Title |
Source: Public Records
Mortgage History
| Date | Status | Borrower | Loan Amount |
|---|---|---|---|
| Open | Hadley Thomas A | $325,350 | |
| Previous Owner | Hadley Thomas Allan | $195,840 |
Source: Public Records
Tax History
| Year | Tax Paid | Tax Assessment Tax Assessment Total Assessment is a certain percentage of the fair market value that is determined by local assessors to be the total taxable value of land and additions on the property. | Land | Improvement |
|---|---|---|---|---|
| 2025 | $3,108 | $289,302 | $200,875 | $88,427 |
| 2024 | $3,108 | $283,630 | $196,936 | $86,694 |
| 2023 | $3,028 | $278,069 | $193,074 | $84,995 |
| 2022 | $2,973 | $272,617 | $189,288 | $83,329 |
| 2021 | $2,907 | $267,272 | $185,576 | $81,696 |
| 2020 | $2,889 | $264,532 | $183,673 | $80,859 |
| 2019 | $2,826 | $259,346 | $180,072 | $79,274 |
| 2018 | $2,774 | $254,261 | $176,541 | $77,720 |
| 2017 | $2,716 | $249,276 | $173,079 | $76,197 |
| 2016 | $2,598 | $244,389 | $169,686 | $74,703 |
| 2015 | $2,559 | $240,719 | $167,138 | $73,581 |
| 2014 | $2,510 | $236,004 | $163,864 | $72,140 |
Source: Public Records
Map
Nearby Homes
- 94 Smokestone
- 7 Spring Buck
- 6 Whitecloud
- 11 Thunder Trail Unit 6
- 32 Spinnaker Unit 71
- 94 Greenfield Unit 99
- 111 Greenfield
- 53 Woodleaf
- 19 Waterway Unit 9
- 30 Waterway Unit 43
- 26 Claret Unit 40
- 59 Fox Hollow Unit 36
- 7 Onyx Unit 11
- 5 Cannes
- 18 Decente
- 52 Weepingwood
- 36 Bloomdale
- 20 Wintermist
- 154 Echo Run Unit 66
- 39 Foxboro
- 2 Silkleaf
- 4 Silkleaf
- 41 Smokestone Unit 39
- 41 Smokestone
- 17 Smokestone Unit 28
- 17 Smokestone
- 6 Silkleaf
- 43 Smokestone
- 8 Silkleaf
- 7 Smokestone Unit 3
- 55 Smokestone Unit 44
- 7 Smokestone
- 51 Smokestone
- 55 Smokestone
- 57 Smokestone Unit 23
- 57 Smokestone
- 2 Sunriver
- 1 Fairdawn
- 10 Silkleaf
- 49 Smokestone Unit 43
Your Personal Tour Guide
Ask me questions while you tour the home.