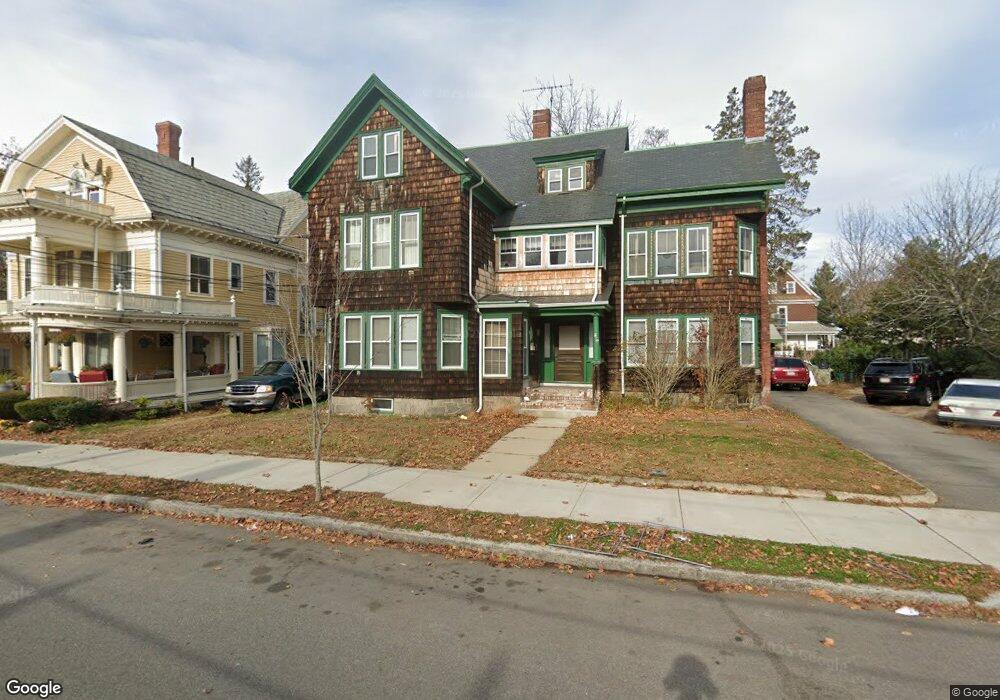
33 South St Brockton, MA 02301
Clifton Heights NeighborhoodEstimated Value: $142,000 - $795,000
7
Beds
3
Baths
3,425
Sq Ft
$126/Sq Ft
Est. Value
About This Home
This home is located at 33 South St, Brockton, MA 02301 and is currently estimated at $430,242, approximately $125 per square foot. 33 South St is a home with nearby schools including Davis K-8 School, John F. Kennedy Elementary School, and South Middle School.
Ownership History
Date
Name
Owned For
Owner Type
Purchase Details
Closed on
Jan 27, 1992
Sold by
Peoples Sb Of Brockton
Bought by
Barros Fausto J
Current Estimated Value
Home Financials for this Owner
Home Financials are based on the most recent Mortgage that was taken out on this home.
Original Mortgage
$60,000
Interest Rate
8.45%
Mortgage Type
Purchase Money Mortgage
Purchase Details
Closed on
Apr 18, 1991
Sold by
33-35 South St Rt
Bought by
Peoples Sb Of Brockton
Create a Home Valuation Report for This Property
The Home Valuation Report is an in-depth analysis detailing your home's value as well as a comparison with similar homes in the area
Home Values in the Area
Average Home Value in this Area
Purchase History
| Date | Buyer | Sale Price | Title Company |
|---|---|---|---|
| Barros Fausto J | $70,000 | -- | |
| Peoples Sb Of Brockton | $120,000 | -- |
Source: Public Records
Mortgage History
| Date | Status | Borrower | Loan Amount |
|---|---|---|---|
| Open | Peoples Sb Of Brockton | $229,100 | |
| Closed | Peoples Sb Of Brockton | $185,000 | |
| Closed | Peoples Sb Of Brockton | $60,000 |
Source: Public Records
Tax History Compared to Growth
Tax History
| Year | Tax Paid | Tax Assessment Tax Assessment Total Assessment is a certain percentage of the fair market value that is determined by local assessors to be the total taxable value of land and additions on the property. | Land | Improvement |
|---|---|---|---|---|
| 2025 | $1,706 | $140,900 | $140,900 | $0 |
| 2024 | $5,599 | $465,800 | $140,900 | $324,900 |
| 2023 | $8,233 | $634,300 | $108,100 | $526,200 |
| 2022 | $8,118 | $581,100 | $98,300 | $482,800 |
| 2021 | $7,230 | $498,600 | $82,500 | $416,100 |
| 2020 | $6,519 | $430,300 | $76,500 | $353,800 |
| 2019 | $6,444 | $414,700 | $74,300 | $340,400 |
| 2018 | $5,780 | $359,900 | $74,300 | $285,600 |
| 2017 | $5,841 | $362,800 | $74,300 | $288,500 |
| 2016 | $4,675 | $269,300 | $72,300 | $197,000 |
| 2015 | $3,870 | $213,200 | $72,300 | $140,900 |
| 2014 | $3,796 | $209,400 | $72,300 | $137,100 |
Source: Public Records
Map
Nearby Homes
- 39 South St
- 27 South St
- 34 W Chestnut St
- 40 W Chestnut St
- 34 South St
- 34 South St Unit 1
- 19 South St
- 46 W Chestnut St
- 36 South St
- 30 W Chestnut St
- 47 South St
- 30 South St
- 30 South St Unit 1R
- 42 South St
- 26 W Chestnut St
- 17 South St
- 26 South St
- 20 W Chestnut St
- 48 W Chestnut St
- 48 W Chestnut St Unit 2