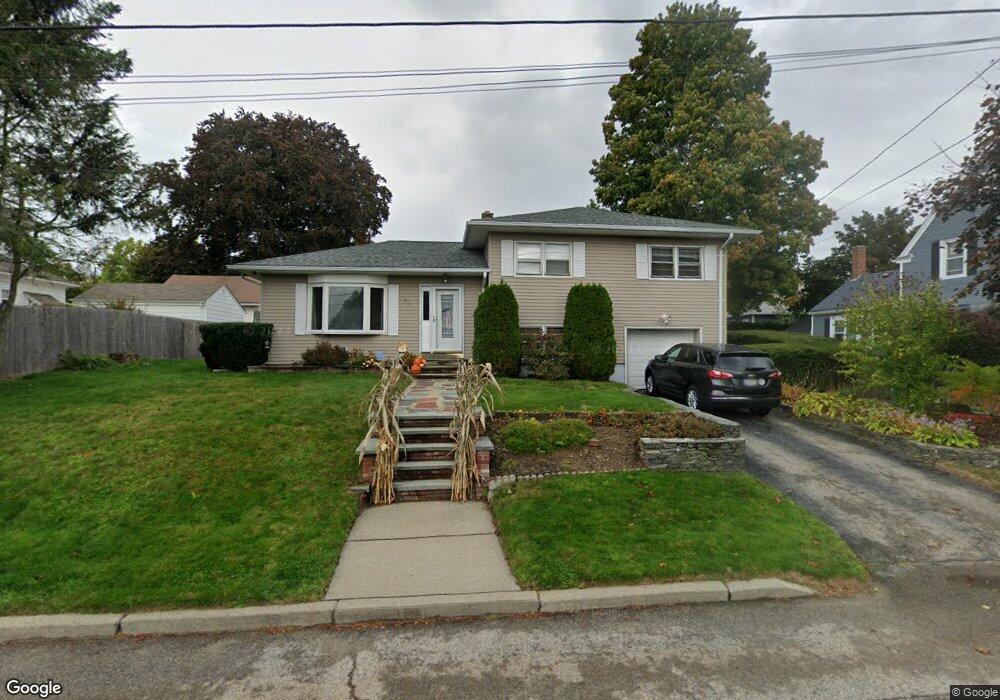
33 South St Cranston, RI 02920
Meshanticut NeighborhoodEstimated Value: $439,000 - $535,000
3
Beds
2
Baths
1,832
Sq Ft
$256/Sq Ft
Est. Value
About This Home
This home is located at 33 South St, Cranston, RI 02920 and is currently estimated at $469,496, approximately $256 per square foot. 33 South St is a home located in Providence County with nearby schools including Glen Hills School, Western Hills Middle School, and Cranston High School West.
Ownership History
Date
Name
Owned For
Owner Type
Purchase Details
Closed on
Apr 2, 2024
Sold by
Rebello Anthony D
Bought by
Rebello Anthony D and Rebello Kristen M
Current Estimated Value
Purchase Details
Closed on
Jan 12, 2009
Sold by
Piacitelli Lynn M
Bought by
Rebello 3Rd Anthony D
Home Financials for this Owner
Home Financials are based on the most recent Mortgage that was taken out on this home.
Original Mortgage
$159,468
Interest Rate
5.99%
Mortgage Type
Purchase Money Mortgage
Purchase Details
Closed on
Dec 21, 2005
Sold by
Kraus Elizabeth M
Bought by
Piacitelli Lynn M
Purchase Details
Closed on
Oct 14, 1994
Sold by
Cordy Catherine Spazia
Bought by
Krause Elizabeth M and Krause Michael
Create a Home Valuation Report for This Property
The Home Valuation Report is an in-depth analysis detailing your home's value as well as a comparison with similar homes in the area
Home Values in the Area
Average Home Value in this Area
Purchase History
| Date | Buyer | Sale Price | Title Company |
|---|---|---|---|
| Rebello Anthony D | -- | None Available | |
| Rebello 3Rd Anthony D | $186,500 | -- | |
| Piacitelli Lynn M | $311,000 | -- | |
| Krause Elizabeth M | $117,000 | -- |
Source: Public Records
Mortgage History
| Date | Status | Borrower | Loan Amount |
|---|---|---|---|
| Previous Owner | Krause Elizabeth M | $189,763 | |
| Previous Owner | Krause Elizabeth M | $152,125 | |
| Previous Owner | Krause Elizabeth M | $159,468 |
Source: Public Records
Tax History Compared to Growth
Tax History
| Year | Tax Paid | Tax Assessment Tax Assessment Total Assessment is a certain percentage of the fair market value that is determined by local assessors to be the total taxable value of land and additions on the property. | Land | Improvement |
|---|---|---|---|---|
| 2025 | $4,698 | $338,500 | $110,500 | $228,000 |
| 2024 | $4,607 | $338,500 | $110,500 | $228,000 |
| 2023 | $4,254 | $225,100 | $72,700 | $152,400 |
| 2022 | $4,167 | $225,100 | $72,700 | $152,400 |
| 2021 | $4,052 | $225,100 | $72,700 | $152,400 |
| 2020 | $3,973 | $191,300 | $69,300 | $122,000 |
| 2019 | $3,973 | $191,300 | $69,300 | $122,000 |
| 2018 | $3,881 | $191,300 | $69,300 | $122,000 |
| 2017 | $3,971 | $173,100 | $62,300 | $110,800 |
| 2016 | $3,886 | $173,100 | $62,300 | $110,800 |
| 2015 | $3,886 | $173,100 | $62,300 | $110,800 |
| 2014 | $3,700 | $162,000 | $62,300 | $99,700 |
Source: Public Records
Map
Nearby Homes
- 29 Valley St
- 0 Wain St
- 203 Dean Ridge Ct
- 7 Oak Tree Ln
- 178 Highland St
- 180 Highland St
- 145 E Hill Dr
- 189 Summit Dr
- 46 Lilyana Way
- 275 Meshanticut Valley Pkwy
- 21 Charles St
- 45 Hamden Rd
- 51 E Bel Air Rd
- 0 Phenix Ave Unit 1384514
- 141 Glen Ridge Rd
- 71 Norton Ave
- 200 Hoffman Ave Unit 505
- 132 Hoffman Ave Unit 115
- 132 Hoffman Ave Unit 207
- 132 Hoffman Ave Unit 110