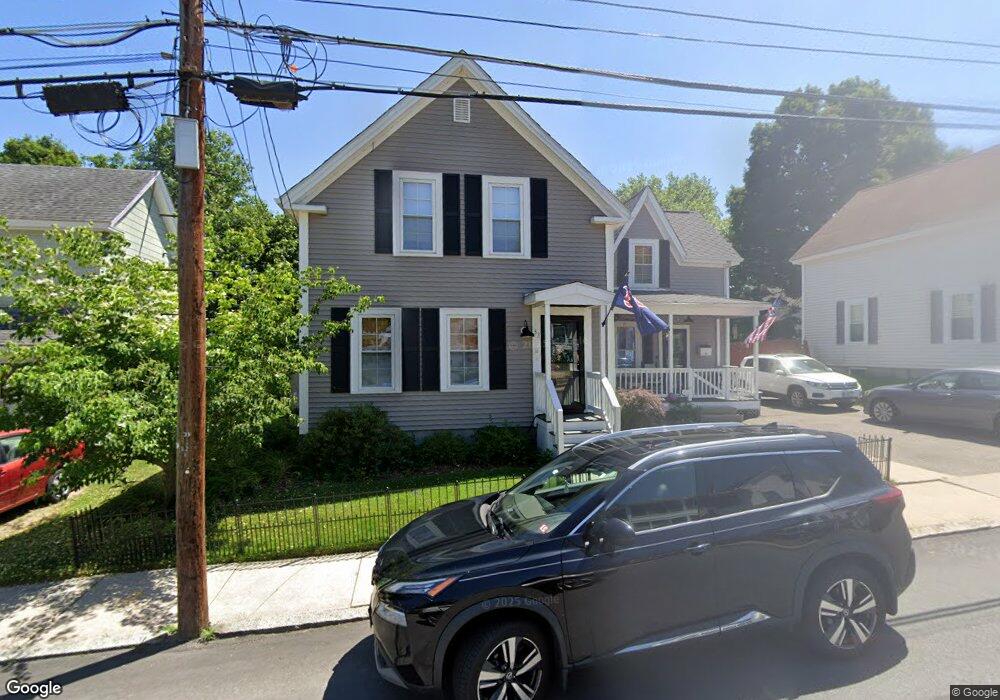
33 Summer St Nashua, NH 03064
North End Nashua NeighborhoodEstimated Value: $415,000 - $430,536
3
Beds
1
Bath
1,323
Sq Ft
$322/Sq Ft
Est. Value
About This Home
This home is located at 33 Summer St, Nashua, NH 03064 and is currently estimated at $426,134, approximately $322 per square foot. 33 Summer St is a home located in Hillsborough County with nearby schools including Mount Pleasant Elementary School, Pennichuck Middle School, and Nashua High School North.
Ownership History
Date
Name
Owned For
Owner Type
Purchase Details
Closed on
Mar 30, 2004
Sold by
Cieplucha Dariusz A and Cieplucha Iwona E
Bought by
Lavoie Lynne A
Current Estimated Value
Home Financials for this Owner
Home Financials are based on the most recent Mortgage that was taken out on this home.
Original Mortgage
$219,600
Interest Rate
5.65%
Mortgage Type
Purchase Money Mortgage
Purchase Details
Closed on
Sep 4, 2001
Sold by
Dolan John J
Bought by
Jones Robin E
Home Financials for this Owner
Home Financials are based on the most recent Mortgage that was taken out on this home.
Original Mortgage
$104,750
Interest Rate
7.06%
Mortgage Type
Purchase Money Mortgage
Purchase Details
Closed on
Aug 14, 1998
Sold by
Piwowarski Lorraine M and Piwowarski Richard P
Bought by
Ciepluchia Iwona E and Ciepluchia Dariusz A
Create a Home Valuation Report for This Property
The Home Valuation Report is an in-depth analysis detailing your home's value as well as a comparison with similar homes in the area
Home Values in the Area
Average Home Value in this Area
Purchase History
| Date | Buyer | Sale Price | Title Company |
|---|---|---|---|
| Lavoie Lynne A | $244,000 | -- | |
| Jones Robin E | $108,000 | -- | |
| Ciepluchia Iwona E | $107,900 | -- |
Source: Public Records
Mortgage History
| Date | Status | Borrower | Loan Amount |
|---|---|---|---|
| Open | Ciepluchia Iwona E | $260,000 | |
| Closed | Ciepluchia Iwona E | $247,000 | |
| Closed | Ciepluchia Iwona E | $219,600 | |
| Previous Owner | Ciepluchia Iwona E | $104,750 |
Source: Public Records
Tax History Compared to Growth
Tax History
| Year | Tax Paid | Tax Assessment Tax Assessment Total Assessment is a certain percentage of the fair market value that is determined by local assessors to be the total taxable value of land and additions on the property. | Land | Improvement |
|---|---|---|---|---|
| 2024 | $6,314 | $397,100 | $118,400 | $278,700 |
| 2023 | $6,207 | $340,500 | $94,800 | $245,700 |
| 2022 | $6,153 | $340,500 | $94,800 | $245,700 |
| 2021 | $5,185 | $223,300 | $63,200 | $160,100 |
| 2020 | $5,006 | $221,400 | $63,200 | $158,200 |
| 2019 | $4,818 | $221,400 | $63,200 | $158,200 |
| 2018 | $4,696 | $221,400 | $63,200 | $158,200 |
| 2017 | $3,992 | $154,800 | $56,000 | $98,800 |
| 2016 | $3,881 | $154,800 | $56,000 | $98,800 |
| 2015 | $3,797 | $154,800 | $56,000 | $98,800 |
| 2014 | $3,723 | $154,800 | $56,000 | $98,800 |
Source: Public Records
Map
Nearby Homes
- 36-38 Courtland St
- 15 Atherton Ave
- 19 Atherton Ave
- 13 Sapphire Ln
- 71 Concord St
- 11 Charles St
- 4 Reservoir St
- 21 Edson St
- 61 Manchester St
- 18 Harbor Ave Unit 208
- 5 Mulberry St
- 0 Baldwin St
- 19 Bartlett Ave
- 38 Central St
- 73 Berkeley St
- 31 Juliana Ave
- 31 Juliana Ave Unit 4
- 13 Mulvanity St
- 3 Opal Way Unit 3
- 1 Opal Way Unit 1