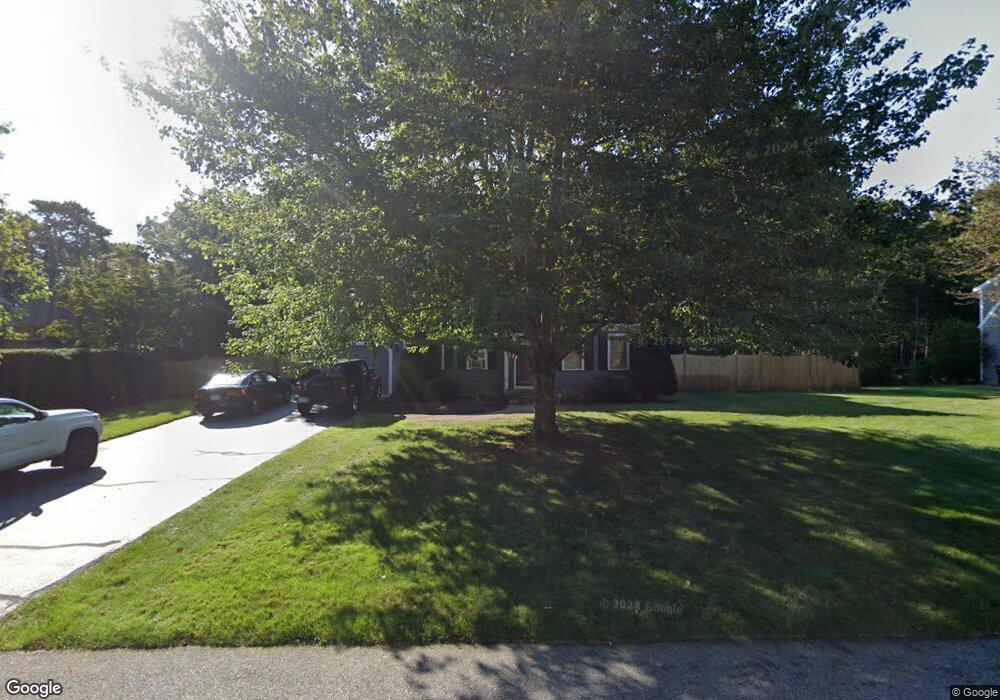
33 Tobisset St Mashpee, MA 02649
Estimated Value: $627,000 - $701,000
3
Beds
2
Baths
1,501
Sq Ft
$440/Sq Ft
Est. Value
About This Home
This home is located at 33 Tobisset St, Mashpee, MA 02649 and is currently estimated at $661,053, approximately $440 per square foot. 33 Tobisset St is a home located in Barnstable County with nearby schools including Kenneth C. Coombs School, Quashnet School, and Mashpee Middle School.
Ownership History
Date
Name
Owned For
Owner Type
Purchase Details
Closed on
Jun 15, 2023
Sold by
Teed Debra A and Teed Don B
Bought by
Chautauqua Rt and Teed
Current Estimated Value
Purchase Details
Closed on
Apr 30, 1999
Sold by
Hambly Paul E and Hambly Margaret B
Bought by
Teed Don B
Home Financials for this Owner
Home Financials are based on the most recent Mortgage that was taken out on this home.
Original Mortgage
$169,950
Interest Rate
6.95%
Mortgage Type
Purchase Money Mortgage
Purchase Details
Closed on
Jul 26, 1991
Sold by
Bayport Homes Inc
Bought by
Hambly Paul E and Hambly Margaret B
Home Financials for this Owner
Home Financials are based on the most recent Mortgage that was taken out on this home.
Original Mortgage
$135,000
Interest Rate
9.58%
Mortgage Type
Purchase Money Mortgage
Create a Home Valuation Report for This Property
The Home Valuation Report is an in-depth analysis detailing your home's value as well as a comparison with similar homes in the area
Home Values in the Area
Average Home Value in this Area
Purchase History
| Date | Buyer | Sale Price | Title Company |
|---|---|---|---|
| Chautauqua Rt | -- | None Available | |
| Teed Don B | $165,450 | -- | |
| Hambly Paul E | $143,000 | -- | |
| Hambly Paul E | $143,000 | -- |
Source: Public Records
Mortgage History
| Date | Status | Borrower | Loan Amount |
|---|---|---|---|
| Previous Owner | Hambly Paul E | $167,550 | |
| Previous Owner | Hambly Paul E | $169,950 | |
| Previous Owner | Hambly Paul E | $135,000 |
Source: Public Records
Tax History Compared to Growth
Tax History
| Year | Tax Paid | Tax Assessment Tax Assessment Total Assessment is a certain percentage of the fair market value that is determined by local assessors to be the total taxable value of land and additions on the property. | Land | Improvement |
|---|---|---|---|---|
| 2025 | $4,194 | $633,600 | $216,600 | $417,000 |
| 2024 | $3,857 | $599,800 | $197,000 | $402,800 |
| 2023 | $3,601 | $513,700 | $187,500 | $326,200 |
| 2022 | $3,424 | $419,100 | $152,500 | $266,600 |
| 2021 | $3,360 | $370,500 | $137,300 | $233,200 |
| 2020 | $3,240 | $356,400 | $132,100 | $224,300 |
| 2019 | $3,078 | $340,100 | $132,100 | $208,000 |
| 2018 | $1,586 | $329,700 | $126,300 | $203,400 |
| 2017 | $2,833 | $308,300 | $126,300 | $182,000 |
| 2016 | $2,706 | $292,900 | $126,300 | $166,600 |
| 2015 | $2,605 | $286,000 | $126,300 | $159,700 |
| 2014 | $2,680 | $285,400 | $126,000 | $159,400 |
Source: Public Records
Map
Nearby Homes
- 45 Pequot Rd
- 235 Main St
- 30 Windsor Point
- 6 Mayfair Ct
- 6 Mayfair Ct Unit 6
- 20 Windsor Way
- 22 Stratford Ridge Unit 22
- 4 Bishops Park
- 5 Darby Point Unit 5
- 35 Claulise Ln
- 131 Timberlane Dr
- 170 Forest Hills Rd
- 75 Bob White Run
- 16 Spring Brook Ln
- 295 Pheasant Hill Cir
- 783
- 45 Fox Hill Rd
- 226 Dunrobin Rd
- 95 Brittany Dr
- 27 Tobisset St
- 34 Tobisset St
- 30 Tobisset St
- 40 Tobisset St
- 43 Tobisset St
- 21 Tobisset St
- 24 Tobisset St
- 14 Michelle Ln
- 50 Tobisset St
- 16 Tobisset St
- 16 Tobisset St Unit NA
- 11 Michelle Ln
- 45 Tobisset St
- 19 Tobisset St
- 10 Michelle Ln
- 56 Tobisset St
- 8 Tobisset St
- 65 Shields Rd
- 53 Tobisset St
- 15 Tobisset St