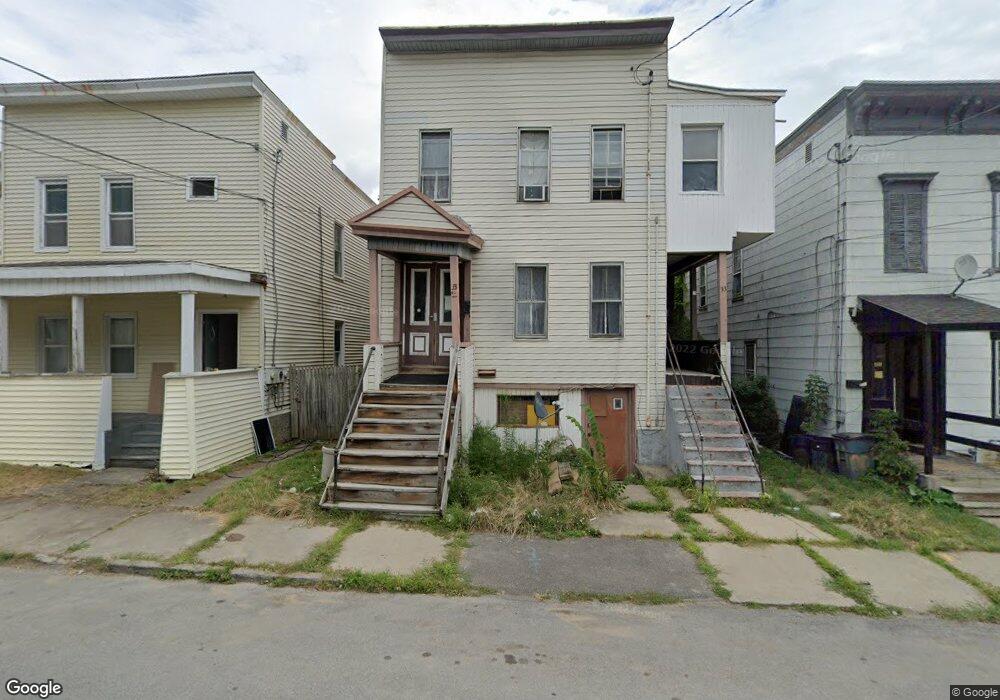
33 Union St Amsterdam, NY 12010
Estimated Value: $70,126
6
Beds
2
Baths
1,620
Sq Ft
$43/Sq Ft
Est. Value
About This Home
This home is located at 33 Union St, Amsterdam, NY 12010 and is currently priced at $70,126, approximately $43 per square foot. 33 Union St is a home located in Montgomery County with nearby schools including Amsterdam High School and St. Mary's Institute.
Ownership History
Date
Name
Owned For
Owner Type
Purchase Details
Closed on
Mar 8, 2023
Sold by
Bapaz Emuna Llc
Bought by
Amsterdam 36 Llc
Current Estimated Value
Home Financials for this Owner
Home Financials are based on the most recent Mortgage that was taken out on this home.
Original Mortgage
$1,190,250
Outstanding Balance
$1,152,883
Interest Rate
6.13%
Mortgage Type
Purchase Money Mortgage
Purchase Details
Closed on
Feb 16, 2006
Sold by
Phelps Kevin
Bought by
Mazel Property Holdings Llc
Purchase Details
Closed on
Jan 31, 2002
Sold by
Lanzi Lawrence A
Bought by
Phelps Kevin
Create a Home Valuation Report for This Property
The Home Valuation Report is an in-depth analysis detailing your home's value as well as a comparison with similar homes in the area
Home Values in the Area
Average Home Value in this Area
Purchase History
| Date | Buyer | Sale Price | Title Company |
|---|---|---|---|
| Amsterdam 36 Llc | $929,000 | None Available | |
| Mazel Property Holdings Llc | $43,000 | Douglas Landon | |
| Phelps Kevin | -- | None |
Source: Public Records
Mortgage History
| Date | Status | Borrower | Loan Amount |
|---|---|---|---|
| Open | Amsterdam 36 Llc | $1,190,250 |
Source: Public Records
Tax History Compared to Growth
Tax History
| Year | Tax Paid | Tax Assessment Tax Assessment Total Assessment is a certain percentage of the fair market value that is determined by local assessors to be the total taxable value of land and additions on the property. | Land | Improvement |
|---|---|---|---|---|
| 2024 | $2,316 | $44,000 | $5,100 | $38,900 |
| 2023 | $1,894 | $44,000 | $5,100 | $38,900 |
| 2022 | $1,814 | $44,000 | $5,100 | $38,900 |
| 2021 | $2,123 | $44,000 | $5,100 | $38,900 |
| 2020 | $1,992 | $44,000 | $5,100 | $38,900 |
| 2019 | $1,142 | $44,000 | $5,100 | $38,900 |
| 2018 | $2,360 | $44,000 | $5,100 | $38,900 |
| 2017 | $3,116 | $44,000 | $5,100 | $38,900 |
| 2016 | $1,942 | $44,000 | $5,100 | $38,900 |
| 2015 | -- | $44,000 | $5,100 | $38,900 |
| 2014 | -- | $44,000 | $5,100 | $38,900 |
Source: Public Records
Map
Nearby Homes