33 Webb St Weymouth, MA 02188
Weymouth Landing NeighborhoodEstimated Value: $544,768 - $601,000
3
Beds
2
Baths
1,165
Sq Ft
$497/Sq Ft
Est. Value
About This Home
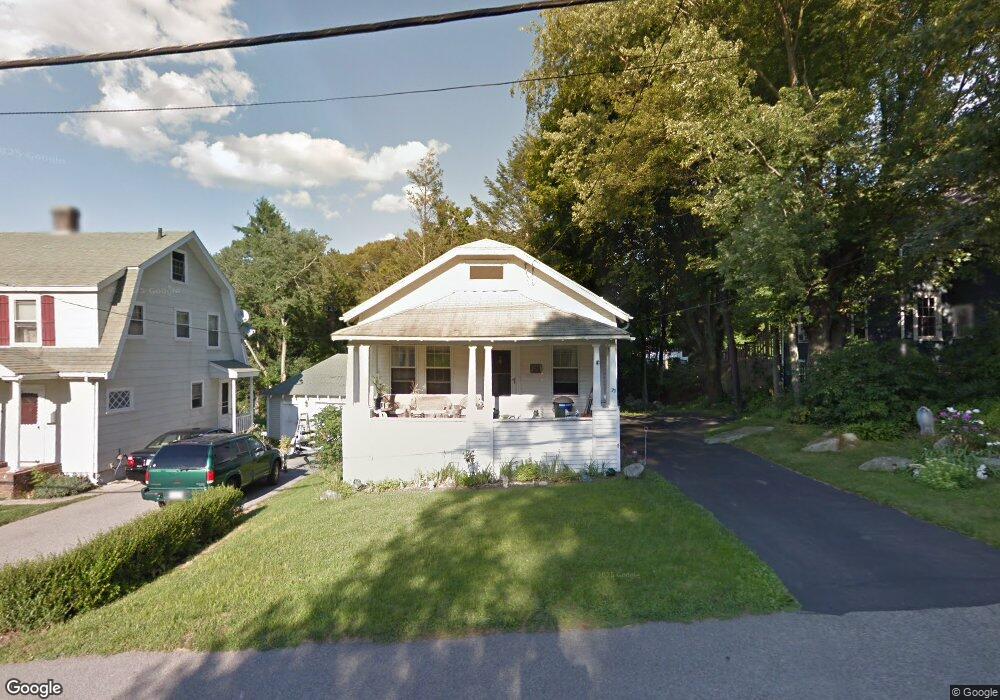
This home is located at 33 Webb St, Weymouth, MA 02188 and is currently estimated at $579,442, approximately $497 per square foot. 33 Webb St is a home located in Norfolk County with nearby schools including Frederick C Murphy, Abigail Adams Middle School, and Weymouth Middle School Chapman.
Ownership History
Date
Name
Owned For
Owner Type
Purchase Details
Closed on
Jan 19, 2021
Sold by
Enos John J and Enos Kathryn A
Bought by
Enos Ft
Current Estimated Value
Purchase Details
Closed on
Feb 25, 1988
Sold by
Corbett John W
Bought by
Proietti Mary F
Create a Home Valuation Report for This Property
The Home Valuation Report is an in-depth analysis detailing your home's value as well as a comparison with similar homes in the area
Home Values in the Area
Average Home Value in this Area
Purchase History
| Date | Buyer | Sale Price | Title Company |
|---|---|---|---|
| Enos Ft | -- | None Available | |
| Proietti Mary F | $149,900 | -- |
Source: Public Records
Mortgage History
| Date | Status | Borrower | Loan Amount |
|---|---|---|---|
| Previous Owner | Proietti Mary F | $190,500 | |
| Previous Owner | Proietti Mary F | $55,500 | |
| Previous Owner | Proietti Mary F | $102,000 | |
| Previous Owner | Proietti Mary F | $93,640 |
Source: Public Records
Tax History
| Year | Tax Paid | Tax Assessment Tax Assessment Total Assessment is a certain percentage of the fair market value that is determined by local assessors to be the total taxable value of land and additions on the property. | Land | Improvement |
|---|---|---|---|---|
| 2025 | $4,850 | $480,200 | $223,200 | $257,000 |
| 2024 | $4,697 | $457,400 | $212,600 | $244,800 |
| 2023 | $4,428 | $423,700 | $196,900 | $226,800 |
| 2022 | $4,616 | $402,800 | $182,300 | $220,500 |
| 2021 | $4,189 | $356,800 | $182,300 | $174,500 |
| 2020 | $3,975 | $333,500 | $182,300 | $151,200 |
| 2019 | $3,880 | $320,100 | $175,300 | $144,800 |
| 2018 | $3,764 | $301,100 | $166,900 | $134,200 |
| 2017 | $3,518 | $274,600 | $159,000 | $115,600 |
| 2016 | $3,380 | $264,100 | $152,900 | $111,200 |
| 2015 | $3,190 | $247,300 | $146,000 | $101,300 |
| 2014 | $3,055 | $229,700 | $135,800 | $93,900 |
Source: Public Records
Map
Nearby Homes
- 46 Roosevelt Rd
- 19 Vine St Unit 3
- 19 Vine St Unit 2
- 25 Richmond St
- 11 Richmond St
- 122 Washington St Unit Twenty-two
- 211 Roosevelt Rd
- 33 Congress St
- 15 Summer St
- 37 Lantern Ln
- 41 Lantern Ln
- 16 Beechwood Rd
- 54 Edgemont Rd
- 49 Cornish St
- 70 Biscayne Ave
- 47 Academy Ave
- 82 Lester Ln
- 116 Greenvale Ave
- 300 Commercial St Unit 23
- 270 Middle St
Your Personal Tour Guide
Ask me questions while you tour the home.