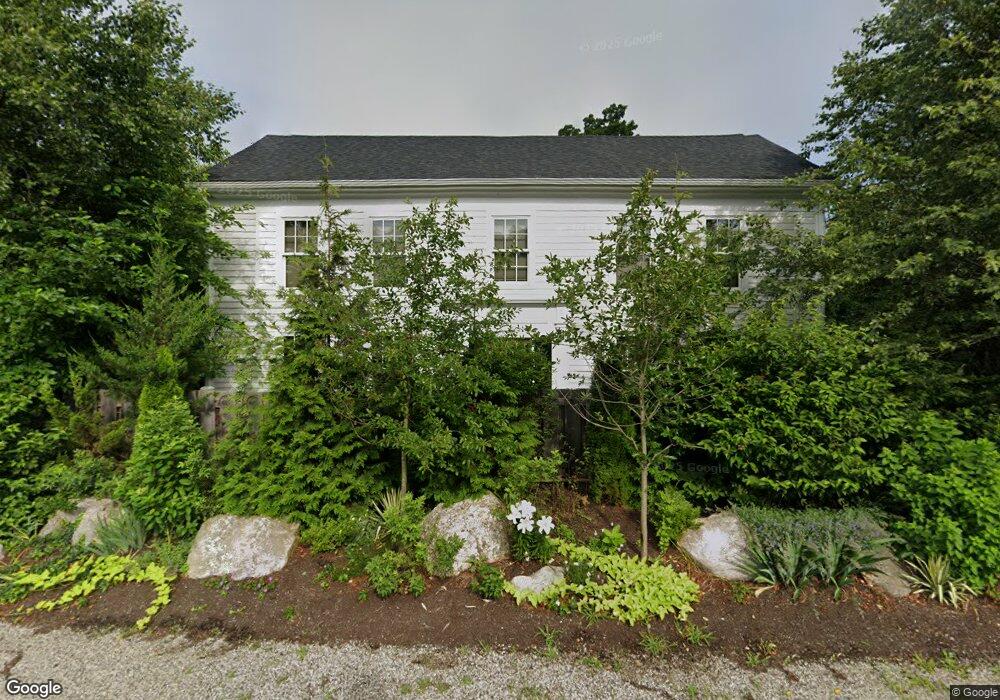
33 West St West Hatfield, MA 01088
Estimated Value: $305,000 - $538,040
4
Beds
2
Baths
2,805
Sq Ft
$145/Sq Ft
Est. Value
About This Home
This home is located at 33 West St, West Hatfield, MA 01088 and is currently estimated at $407,680, approximately $145 per square foot. 33 West St is a home located in Hampshire County with nearby schools including Brooklyn Center Middle School, The Montessori School of Northampton, and Lander Grinspoon Academy.
Ownership History
Date
Name
Owned For
Owner Type
Purchase Details
Closed on
Mar 12, 2009
Sold by
Fieldstone Mortgage In
Bought by
Stevens Craig
Current Estimated Value
Purchase Details
Closed on
Aug 7, 2008
Sold by
Young Brent
Bought by
Hsbc Bank Usa
Create a Home Valuation Report for This Property
The Home Valuation Report is an in-depth analysis detailing your home's value as well as a comparison with similar homes in the area
Home Values in the Area
Average Home Value in this Area
Purchase History
| Date | Buyer | Sale Price | Title Company |
|---|---|---|---|
| Stevens Craig | $160,000 | -- | |
| Hsbc Bank Usa | $326,250 | -- |
Source: Public Records
Tax History Compared to Growth
Tax History
| Year | Tax Paid | Tax Assessment Tax Assessment Total Assessment is a certain percentage of the fair market value that is determined by local assessors to be the total taxable value of land and additions on the property. | Land | Improvement |
|---|---|---|---|---|
| 2025 | $6,243 | $451,091 | $130,291 | $320,800 |
| 2024 | $6,047 | $394,981 | $111,581 | $283,400 |
| 2023 | $5,088 | $377,430 | $106,430 | $271,000 |
| 2022 | $4,998 | $365,633 | $94,633 | $271,000 |
| 2021 | $5,054 | $356,138 | $85,138 | $271,000 |
| 2020 | $4,819 | $356,138 | $85,138 | $271,000 |
| 2019 | $4,389 | $315,987 | $73,687 | $242,300 |
| 2018 | $4,288 | $315,740 | $73,440 | $242,300 |
| 2017 | $4,192 | $317,078 | $73,978 | $243,100 |
| 2016 | $4,162 | $315,781 | $72,681 | $243,100 |
| 2015 | $3,936 | $298,881 | $68,181 | $230,700 |
| 2014 | $4,005 | $316,100 | $82,400 | $233,700 |
Source: Public Records
Map
Nearby Homes
- 2B Linseed Rd
- 34 Gore Ave
- 21 Dwight St
- 121 West St
- 12 Dwight St
- 43 Laurel Park Unit 43
- 66 Laurel Park Unit 66
- 93 Laurel Park Unit 93
- 106 Elm St
- 18 Elm St
- 0 Pantry Rd Unit 73430264
- 32 Stonewall Dr
- 0 Old Stage Rd Unit 73394977
- 0 Straits Rd
- 58 Main St Unit 4
- 58 Main St Unit 3
- 45 N Farms Rd
- 37 N Farms Rd
- 80 Damon Rd Unit 5104
- 136 Main St