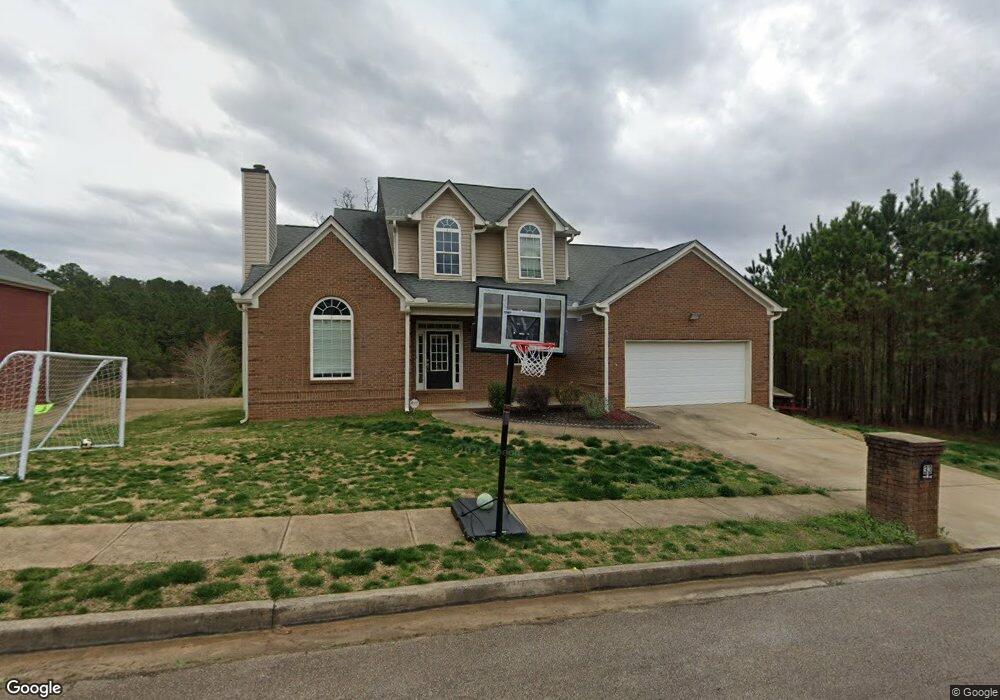
33 Westmoreland Lake Dr Unit 16 Buchanan, GA 30113
Estimated Value: $342,775 - $391,000
5
Beds
3
Baths
2,617
Sq Ft
$142/Sq Ft
Est. Value
About This Home
This home is located at 33 Westmoreland Lake Dr Unit 16, Buchanan, GA 30113 and is currently estimated at $371,694, approximately $142 per square foot. 33 Westmoreland Lake Dr Unit 16 is a home located in Haralson County with nearby schools including Haralson County High School.
Ownership History
Date
Name
Owned For
Owner Type
Purchase Details
Closed on
Nov 28, 2017
Sold by
King Tony H
Bought by
Hord Christopher M and Hord Sharon
Current Estimated Value
Home Financials for this Owner
Home Financials are based on the most recent Mortgage that was taken out on this home.
Original Mortgage
$170,400
Outstanding Balance
$143,462
Interest Rate
3.94%
Mortgage Type
New Conventional
Estimated Equity
$228,232
Purchase Details
Closed on
Aug 2, 2012
Sold by
King Tony H
Bought by
King Tony H and King Kathy
Home Financials for this Owner
Home Financials are based on the most recent Mortgage that was taken out on this home.
Original Mortgage
$171,830
Interest Rate
3.5%
Mortgage Type
FHA
Purchase Details
Closed on
May 9, 2006
Sold by
D & W Construction Llc
Bought by
Hill Bryan E
Purchase Details
Closed on
Nov 19, 2004
Bought by
D & W Construction Llc
Create a Home Valuation Report for This Property
The Home Valuation Report is an in-depth analysis detailing your home's value as well as a comparison with similar homes in the area
Home Values in the Area
Average Home Value in this Area
Purchase History
| Date | Buyer | Sale Price | Title Company |
|---|---|---|---|
| Hord Christopher M | $213,000 | -- | |
| King Tony H | $175,000 | -- | |
| King Tony H | $175,000 | -- | |
| Hill Bryan E | $110,000 | -- | |
| Hill Bryan E | $110,000 | -- | |
| D & W Construction Llc | -- | -- |
Source: Public Records
Mortgage History
| Date | Status | Borrower | Loan Amount |
|---|---|---|---|
| Open | Hord Christopher M | $170,400 | |
| Previous Owner | King Tony H | $171,830 |
Source: Public Records
Tax History Compared to Growth
Tax History
| Year | Tax Paid | Tax Assessment Tax Assessment Total Assessment is a certain percentage of the fair market value that is determined by local assessors to be the total taxable value of land and additions on the property. | Land | Improvement |
|---|---|---|---|---|
| 2024 | $5,670 | $147,437 | $5,000 | $142,437 |
| 2023 | $6,058 | $148,142 | $5,000 | $143,142 |
| 2022 | $3,421 | $116,756 | $5,000 | $111,756 |
| 2021 | $2,759 | $89,827 | $5,000 | $84,827 |
| 2020 | $2,489 | $80,970 | $5,000 | $75,970 |
| 2019 | $2,422 | $76,426 | $5,000 | $71,426 |
| 2018 | $2,745 | $88,626 | $5,000 | $83,626 |
| 2017 | $3,387 | $93,798 | $5,000 | $88,798 |
| 2016 | $2,094 | $70,352 | $5,000 | $65,352 |
| 2015 | $2,092 | $70,228 | $5,000 | $65,228 |
| 2014 | $2,836 | $95,986 | $6,500 | $89,486 |
Source: Public Records
Map
Nearby Homes
- 265 Perry Ln
- 43 Mimosa St
- 51 Perry Ln
- 15 Willow Leaf Dr
- 15 Weaver St
- 116 Young St
- 315 Carrollton St
- 1601 Bethlehem Church Rd
- 100 Tallapoosa Rd
- 181 Tallapoosa St
- 533 Wesley Camp Rd
- 3734 Georgia 120
- 101 3rd Ave
- 3063 Georgia 120
- 3063 Georgia Highway 120
- 2977 Georgia Highway 120
- 96 Rosemary Way
- 80 Rosemary Way
- 91 Rosemary Way
- 40 Red Oak Cir
- 33 Westmoreland Lake Dr
- 39 Westmoreland Lake Dr
- 25 Westmoreland Lake Dr
- 21 Westmoreland Lake Dr
- 47 Westmoreland Lake Dr
- 76 Westmoreland Lake Dr
- 20 Westmoreland Lake Dr
- 88 Westmoreland Lake Dr
- 51 Westmoreland Lake Dr
- 17 Westmoreland Lake Dr
- 57 Westmoreland Lake Dr
- 16 Westmoreland Lake Dr
- 95 Westmoreland Rd
- 13 Westmoreland Lake Dr
- 5 Westmoreland Lake Dr
- 5 Westmoreland Lake Dr Unit 10
- 14 Westmoreland Lake Dr
- 120 Westmoreland Lake Dr
- 31 Westmoreland Rd
- 31 Westmoreland Rd Unit 9