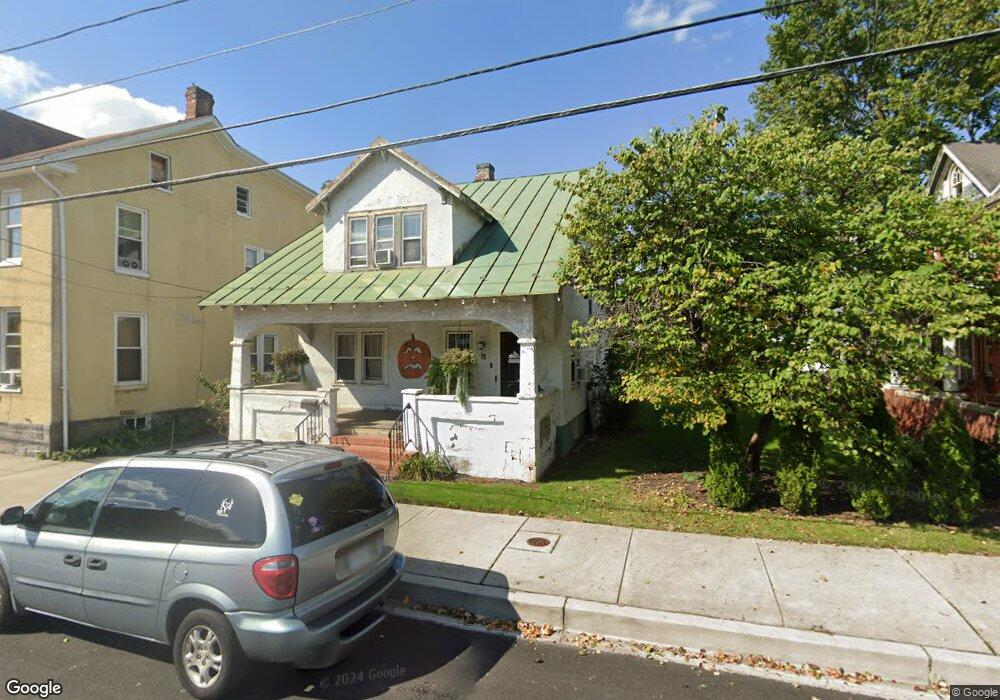
33 York St Taneytown, MD 21787
Estimated Value: $223,000 - $277,000
Studio
1
Bath
1,158
Sq Ft
$223/Sq Ft
Est. Value
About This Home
This home is located at 33 York St, Taneytown, MD 21787 and is currently estimated at $258,134, approximately $222 per square foot. 33 York St is a home located in Carroll County with nearby schools including Taneytown Elementary School, Northwest Middle School, and Francis Scott Key High School.
Ownership History
Date
Name
Owned For
Owner Type
Purchase Details
Closed on
Dec 30, 2021
Sold by
Dijak Tara S and Dijak Russell E
Bought by
Wetherell Tara
Current Estimated Value
Home Financials for this Owner
Home Financials are based on the most recent Mortgage that was taken out on this home.
Original Mortgage
$71,300
Outstanding Balance
$54,748
Interest Rate
2.43%
Mortgage Type
New Conventional
Estimated Equity
$203,386
Purchase Details
Closed on
May 9, 2000
Sold by
Roberson Phillip R
Bought by
Dijak Russell E and Dijak Tara S
Purchase Details
Closed on
Sep 22, 1998
Sold by
Smith Julia P
Bought by
Roberson Phillip R
Create a Home Valuation Report for This Property
The Home Valuation Report is an in-depth analysis detailing your home's value as well as a comparison with similar homes in the area
Purchase History
| Date | Buyer | Sale Price | Title Company |
|---|---|---|---|
| Wetherell Tara | -- | Sage Title | |
| Wetherell Tara | -- | Sage Title | |
| Dijak Russell E | $120,000 | -- | |
| Roberson Phillip R | $73,000 | -- |
Source: Public Records
Mortgage History
| Date | Status | Borrower | Loan Amount |
|---|---|---|---|
| Open | Wetherell Tara | $71,300 | |
| Closed | Wetherell Tara | $71,300 |
Source: Public Records
Tax History
| Year | Tax Paid | Tax Assessment Tax Assessment Total Assessment is a certain percentage of the fair market value that is determined by local assessors to be the total taxable value of land and additions on the property. | Land | Improvement |
|---|---|---|---|---|
| 2025 | $2,671 | $179,300 | $0 | $0 |
| 2024 | $2,531 | $169,900 | $0 | $0 |
| 2023 | $2,408 | $160,500 | $68,600 | $91,900 |
| 2022 | $2,324 | $156,000 | $0 | $0 |
| 2021 | $4,545 | $151,500 | $0 | $0 |
| 2020 | $4,380 | $147,000 | $68,600 | $78,400 |
| 2019 | $1,988 | $143,233 | $0 | $0 |
| 2018 | $2,067 | $139,467 | $0 | $0 |
| 2017 | $2,022 | $135,700 | $0 | $0 |
| 2016 | -- | $135,700 | $0 | $0 |
| 2015 | -- | $135,700 | $0 | $0 |
| 2014 | -- | $138,400 | $0 | $0 |
Source: Public Records
Map
Nearby Homes
Your Personal Tour Guide
Ask me questions while you tour the home.