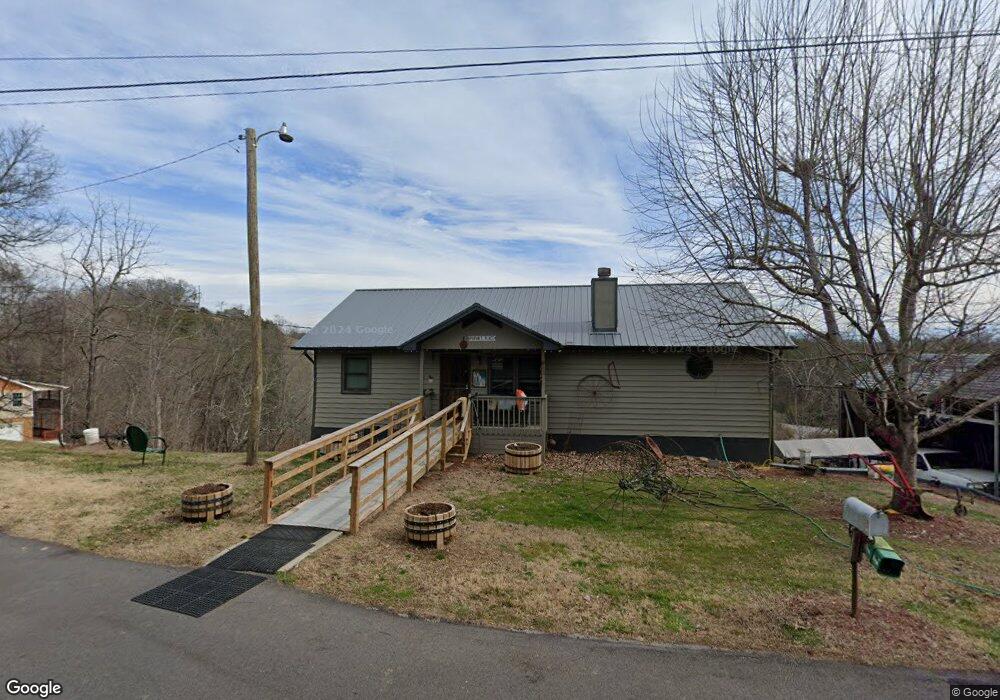
330 Amolee Ln Sevierville, TN 37876
Estimated Value: $389,000 - $460,375
3
Beds
3
Baths
2,122
Sq Ft
$200/Sq Ft
Est. Value
About This Home
This home is located at 330 Amolee Ln, Sevierville, TN 37876 and is currently estimated at $424,688, approximately $200 per square foot. 330 Amolee Ln is a home located in Sevier County with nearby schools including Catons Chapel Elementary School, Jones Cove Elementary School, and Northview Elementary School.
Ownership History
Date
Name
Owned For
Owner Type
Purchase Details
Closed on
Dec 1, 2009
Sold by
Koopman Peter L
Bought by
Loveday Harlan
Current Estimated Value
Home Financials for this Owner
Home Financials are based on the most recent Mortgage that was taken out on this home.
Original Mortgage
$5,000
Interest Rate
5.01%
Purchase Details
Closed on
Jul 31, 2009
Sold by
Deutsche Bank Co Ame
Bought by
Koopman Peter L
Purchase Details
Closed on
Jun 19, 2009
Sold by
Veler Daniel Victor
Bought by
Deutsche Bank Co America
Purchase Details
Closed on
Jul 19, 2005
Sold by
Schneider Ronald F
Bought by
Victor Veler Daniel
Home Financials for this Owner
Home Financials are based on the most recent Mortgage that was taken out on this home.
Original Mortgage
$15,490
Interest Rate
5.59%
Purchase Details
Closed on
Oct 16, 1997
Sold by
David Justus
Bought by
Schneider Ronald F
Create a Home Valuation Report for This Property
The Home Valuation Report is an in-depth analysis detailing your home's value as well as a comparison with similar homes in the area
Home Values in the Area
Average Home Value in this Area
Purchase History
| Date | Buyer | Sale Price | Title Company |
|---|---|---|---|
| Loveday Harlan | $120,000 | -- | |
| Koopman Peter L | $85,000 | -- | |
| Deutsche Bank Co America | $97,750 | -- | |
| Victor Veler Daniel | $154,900 | -- | |
| Schneider Ronald F | $14,000 | -- |
Source: Public Records
Mortgage History
| Date | Status | Borrower | Loan Amount |
|---|---|---|---|
| Closed | Schneider Ronald F | $5,000 | |
| Previous Owner | Schneider Ronald F | $15,490 |
Source: Public Records
Tax History Compared to Growth
Tax History
| Year | Tax Paid | Tax Assessment Tax Assessment Total Assessment is a certain percentage of the fair market value that is determined by local assessors to be the total taxable value of land and additions on the property. | Land | Improvement |
|---|---|---|---|---|
| 2025 | $652 | $44,075 | $6,425 | $37,650 |
| 2024 | $652 | $44,075 | $6,425 | $37,650 |
| 2023 | $652 | $44,075 | $0 | $0 |
| 2022 | $652 | $44,075 | $6,425 | $37,650 |
| 2021 | $652 | $44,075 | $6,425 | $37,650 |
| 2020 | $635 | $44,075 | $6,425 | $37,650 |
| 2019 | $635 | $34,125 | $6,450 | $27,675 |
| 2018 | $635 | $34,125 | $6,450 | $27,675 |
| 2017 | $635 | $34,125 | $6,450 | $27,675 |
| 2016 | $635 | $34,125 | $6,450 | $27,675 |
| 2015 | -- | $36,675 | $0 | $0 |
| 2014 | $598 | $36,664 | $0 | $0 |
Source: Public Records
Map
Nearby Homes
- 334 Amolee Ln
- 324 Oak Vista Ct
- 410 Oak Sky Way
- 406 Oak Sky Way
- 0 Oak Lake Dr Unit 1273077
- Lot 69 Oak Lake Dr
- Lot 55 Oak Lake Dr
- PC 12.01 Newport Hwy
- 440 Oak Sky Way
- 393 & 395 Lane Hollow Rd
- 393 Lane Hollow Rd
- 2031 Oakmont Dr
- 392 Oak Lake Dr
- 2054 Oakmont Dr
- 2039 Oakmont Dr
- 368 Oak Lake Dr
- 340 Lane Hollow Rd
- Lot 15 Mount Buckley Ln
- Lot 17 Mount Buckley Ln
- Lot 1 Mount Buckley Ln