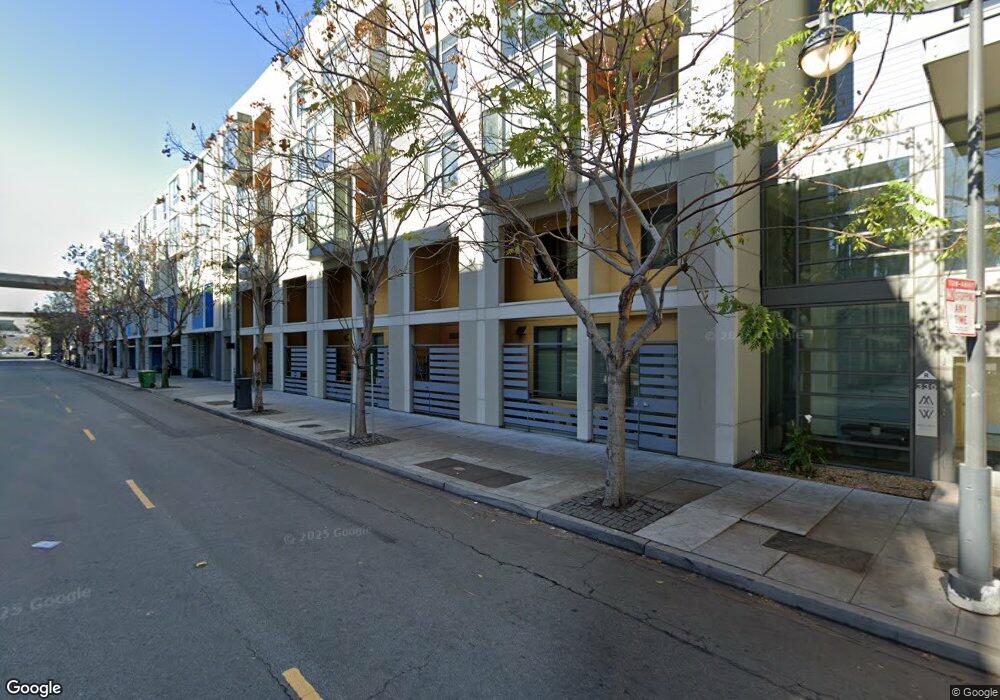
Mission Walk Condos 330 Berry St Unit 506 San Francisco, CA 94158
Mission Bay NeighborhoodEstimated Value: $801,000 - $874,000
2
Beds
2
Baths
903
Sq Ft
$932/Sq Ft
Est. Value
About This Home
This home is located at 330 Berry St Unit 506, San Francisco, CA 94158 and is currently estimated at $841,304, approximately $931 per square foot. 330 Berry St Unit 506 is a home located in San Francisco County with nearby schools including Daniel Webster Elementary School, James Lick Middle School, and The New School of San Francisco.
Ownership History
Date
Name
Owned For
Owner Type
Purchase Details
Closed on
Feb 8, 2023
Sold by
Green Point Land Co
Bought by
Kia Ventures Llc
Current Estimated Value
Purchase Details
Closed on
Jan 30, 2019
Sold by
Maximo Investments Llc
Bought by
Kia Ventures Llc
Purchase Details
Closed on
Dec 28, 2015
Sold by
Green Point Land Company
Bought by
Maximo Investments Llc
Purchase Details
Closed on
Apr 2, 2015
Sold by
Tan Min and Nguyen Hao Phuc
Bought by
Green Point Land Co
Purchase Details
Closed on
Dec 14, 2009
Sold by
Berry Street Llc
Bought by
Tan Min and Nguyen Hao Phuc
Home Financials for this Owner
Home Financials are based on the most recent Mortgage that was taken out on this home.
Original Mortgage
$218,121
Interest Rate
4.35%
Mortgage Type
New Conventional
Create a Home Valuation Report for This Property
The Home Valuation Report is an in-depth analysis detailing your home's value as well as a comparison with similar homes in the area
Home Values in the Area
Average Home Value in this Area
Purchase History
| Date | Buyer | Sale Price | Title Company |
|---|---|---|---|
| Kia Ventures Llc | -- | -- | |
| Kia Ventures Llc | -- | None Available | |
| Maximo Investments Llc | $112,500 | None Available | |
| Green Point Land Co | $224,893 | None Available | |
| Tan Min | -- | Chicago Title Company |
Source: Public Records
Mortgage History
| Date | Status | Borrower | Loan Amount |
|---|---|---|---|
| Previous Owner | Tan Min | $12,500 | |
| Previous Owner | Tan Min | $218,121 |
Source: Public Records
Tax History Compared to Growth
Tax History
| Year | Tax Paid | Tax Assessment Tax Assessment Total Assessment is a certain percentage of the fair market value that is determined by local assessors to be the total taxable value of land and additions on the property. | Land | Improvement |
|---|---|---|---|---|
| 2025 | $10,970 | $884,514 | $442,257 | $442,257 |
| 2024 | $10,970 | $867,172 | $433,586 | $433,586 |
| 2023 | $12,206 | $970,340 | $485,170 | $485,170 |
| 2022 | $11,967 | $951,316 | $475,658 | $475,658 |
| 2021 | $11,753 | $932,664 | $466,332 | $466,332 |
| 2020 | $11,864 | $923,104 | $461,552 | $461,552 |
| 2019 | $11,412 | $905,004 | $452,502 | $452,502 |
| 2018 | $11,028 | $887,260 | $443,630 | $443,630 |
| 2017 | $10,600 | $1,060,848 | $530,424 | $530,424 |
| 2016 | $3,868 | $297,209 | $148,605 | $148,604 |
| 2015 | $3,818 | $292,745 | $146,373 | $146,372 |
| 2014 | $3,720 | $287,011 | $143,506 | $143,505 |
Source: Public Records
About Mission Walk Condos
Map
Nearby Homes
- 300 Berry St Unit 914
- 235 Berry St Unit 417
- 708 Long Bridge St Unit 915
- 708 Long Bridge St Unit 917
- 310 Townsend St Unit 305
- 15 Lucerne St Unit B
- 1 Bluxome St Unit 317
- 260 King St Unit 261
- 260 King St Unit 529
- 260 King St Unit 683
- 260 King St Unit 1107
- 260 King St Unit 741
- 888 7th St Unit 330
- 888 7th St Unit 234
- 888 7th St Unit L20
- 888 7th St Unit 143
- 888 7th St Unit 134
- 888 7th St Unit 231
- 128 Morris St Unit 13
- 250 King St Unit 502
- 330 Berry St Unit 527
- 330 Berry St Unit 526
- 330 Berry St Unit 525
- 330 Berry St Unit 524
- 330 Berry St Unit 523
- 330 Berry St Unit 522
- 330 Berry St Unit 521
- 330 Berry St Unit 520
- 330 Berry St Unit 507
- 330 Berry St Unit 505
- 330 Berry St Unit 504
- 330 Berry St Unit 503
- 330 Berry St Unit 502
- 330 Berry St Unit 501
- 330 Berry St Unit 500
- 330 Berry St Unit 427
- 330 Berry St Unit 426
- 330 Berry St Unit 425
- 330 Berry St Unit 424
- 330 Berry St Unit 423