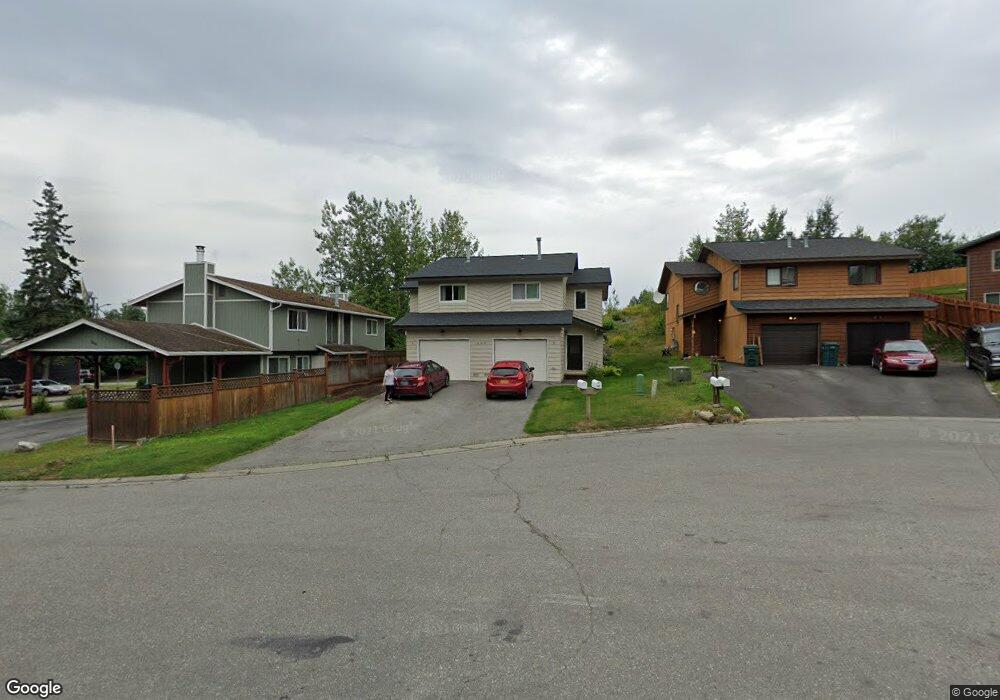
330 Beulah Cir Unit B Anchorage, AK 99504
Northeast Anchorage NeighborhoodEstimated Value: $429,000 - $559,000
3
Beds
2
Baths
1,302
Sq Ft
$378/Sq Ft
Est. Value
About This Home
This home is located at 330 Beulah Cir Unit B, Anchorage, AK 99504 and is currently estimated at $491,909, approximately $377 per square foot. 330 Beulah Cir Unit B is a home located in Anchorage Municipality with nearby schools including Creekside Park Elementary School, Nicholas J. Begich Middle School, and Bartlett High School.
Ownership History
Date
Name
Owned For
Owner Type
Purchase Details
Closed on
Dec 7, 2020
Sold by
Catamount Properties 2018 Llc
Bought by
Guzman Lowen and Guzman Vanessa
Current Estimated Value
Home Financials for this Owner
Home Financials are based on the most recent Mortgage that was taken out on this home.
Original Mortgage
$413,250
Outstanding Balance
$366,217
Interest Rate
2.7%
Mortgage Type
New Conventional
Estimated Equity
$125,692
Purchase Details
Closed on
Nov 30, 2020
Sold by
Catamount Properties 2018 Llc
Bought by
Guzman Lowen and Guzman Vanessa
Home Financials for this Owner
Home Financials are based on the most recent Mortgage that was taken out on this home.
Original Mortgage
$413,250
Outstanding Balance
$366,217
Interest Rate
2.7%
Mortgage Type
New Conventional
Estimated Equity
$125,692
Purchase Details
Closed on
Dec 27, 2019
Sold by
Tydings Gregory E and Argent Mortgage Company Llc
Bought by
Catamount Properties 2018
Purchase Details
Closed on
Dec 16, 2004
Sold by
Harper David A and Harper Maryann
Bought by
Tydings Gregory E
Home Financials for this Owner
Home Financials are based on the most recent Mortgage that was taken out on this home.
Original Mortgage
$228,000
Interest Rate
7.85%
Mortgage Type
Purchase Money Mortgage
Create a Home Valuation Report for This Property
The Home Valuation Report is an in-depth analysis detailing your home's value as well as a comparison with similar homes in the area
Home Values in the Area
Average Home Value in this Area
Purchase History
| Date | Buyer | Sale Price | Title Company |
|---|---|---|---|
| Guzman Lowen | -- | None Available | |
| Guzman Lowen | -- | None Listed On Document | |
| Catamount Properties 2018 | $218,744 | None Available | |
| Tydings Gregory E | -- | Alyeska Title Guaranty Agenc |
Source: Public Records
Mortgage History
| Date | Status | Borrower | Loan Amount |
|---|---|---|---|
| Open | Guzman Lowen | $413,250 | |
| Closed | Guzman Lowen | $413,250 | |
| Previous Owner | Tydings Gregory E | $228,000 | |
| Closed | Tydings Gregory E | $57,000 |
Source: Public Records
Tax History Compared to Growth
Tax History
| Year | Tax Paid | Tax Assessment Tax Assessment Total Assessment is a certain percentage of the fair market value that is determined by local assessors to be the total taxable value of land and additions on the property. | Land | Improvement |
|---|---|---|---|---|
| 2025 | $7,115 | $473,500 | $88,900 | $384,600 |
| 2024 | $7,115 | $440,700 | $88,900 | $351,800 |
| 2023 | $6,846 | $402,000 | $88,900 | $313,100 |
| 2022 | $5,694 | $388,100 | $88,900 | $299,200 |
| 2021 | $6,399 | $355,100 | $88,900 | $266,200 |
| 2020 | $6,084 | $357,900 | $88,900 | $269,000 |
| 2019 | $5,788 | $353,800 | $88,900 | $264,900 |
| 2018 | $4,899 | $348,700 | $77,700 | $271,000 |
| 2017 | $5,268 | $356,400 | $77,700 | $278,700 |
| 2016 | $4,095 | $354,100 | $73,500 | $280,600 |
| 2015 | $4,095 | $338,000 | $73,500 | $264,500 |
| 2014 | $4,095 | $309,700 | $73,500 | $236,200 |
Source: Public Records
Map
Nearby Homes
- 7621 E 4th Ave
- 445 Idaho St
- 555 Oklahoma St
- 243 Creekside St Unit 2
- 7510 Peck Ave
- 177 Michael Ct
- 7313 Peck Ave
- 158 Dean Place
- 179 Oklahoma St
- 7728 Boundary Ave Unit E2
- 125 Dean Place
- 8033 E 6th Ave
- 7614 Boundary Ave Unit 7614
- 810 Hunt Cir
- 905 Muldoon Rd Unit A86
- 111 Muldoon Rd
- 8201 Duben Ave
- 8203 Duben Ave
- 5800 Boundary Ave
- 8101 Peck Ave Unit J70
- 330 Beulah Cir
- 330 Beulah Cir
- 340 Beulah Cir
- 310 Beulah Cir
- 310 Beulah Cir Unit B
- 320 Beulah Cir
- 321 Beulah Cir
- 331 Beulah Cir
- 331 Beulah Cir Unit 1
- 331 Beulah Cir Unit 2
- 341 Beulah Cir
- 300 Beulah Cir
- 301 Beulah Cir
- 7504 E 4th Ave
- 311 Beulah Cir
- 7416 E 4th Ave
- 7421 E 4th Ave Unit 5
- 7421 E 4th Ave
- 7421 E 4th Ave Unit 7401-4
- 7421 E 4th Ave Unit 7431-6