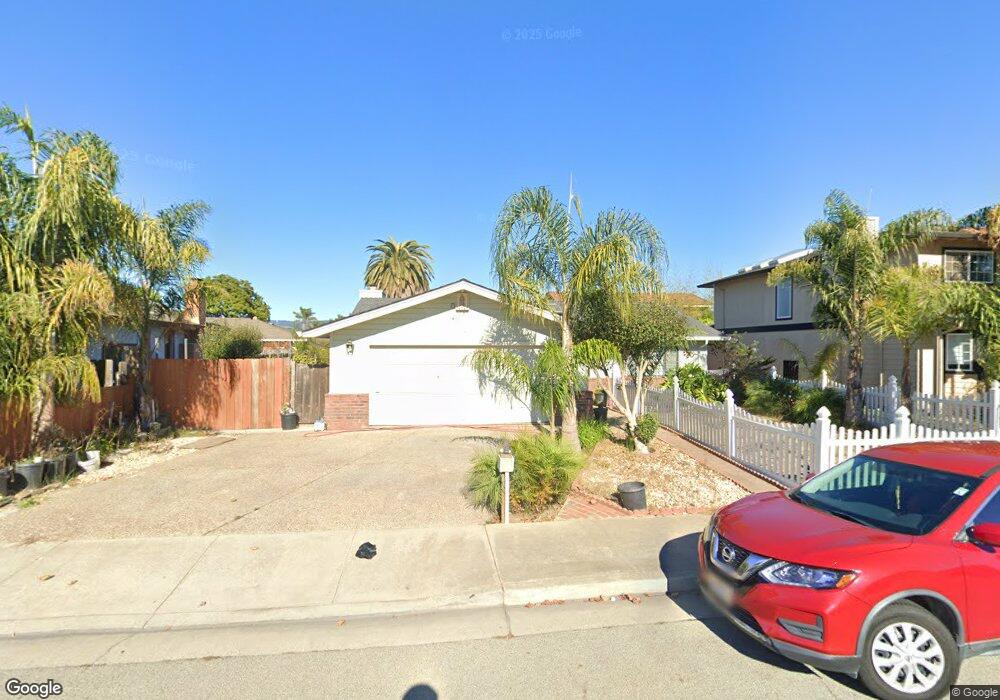
330 Brentwood Dr Watsonville, CA 95076
Estimated Value: $689,000 - $783,798
3
Beds
2
Baths
1,658
Sq Ft
$441/Sq Ft
Est. Value
About This Home
This home is located at 330 Brentwood Dr, Watsonville, CA 95076 and is currently estimated at $730,700, approximately $440 per square foot. 330 Brentwood Dr is a home located in Santa Cruz County with nearby schools including Ann Soldo Elementary School, Lakeview Middle School, and Watsonville High School.
Create a Home Valuation Report for This Property
The Home Valuation Report is an in-depth analysis detailing your home's value as well as a comparison with similar homes in the area
Home Values in the Area
Average Home Value in this Area
Tax History Compared to Growth
Tax History
| Year | Tax Paid | Tax Assessment Tax Assessment Total Assessment is a certain percentage of the fair market value that is determined by local assessors to be the total taxable value of land and additions on the property. | Land | Improvement |
|---|---|---|---|---|
| 2025 | $3,281 | $284,887 | $103,595 | $181,292 |
| 2023 | $3,230 | $273,824 | $99,572 | $174,252 |
| 2022 | $3,171 | $268,455 | $97,620 | $170,835 |
| 2021 | $3,116 | $263,191 | $95,705 | $167,486 |
| 2020 | $3,071 | $260,492 | $94,724 | $165,768 |
| 2019 | $3,015 | $255,385 | $92,867 | $162,518 |
| 2018 | $2,938 | $250,377 | $91,046 | $159,331 |
| 2017 | $2,993 | $245,467 | $89,260 | $156,207 |
| 2016 | $2,915 | $240,654 | $87,510 | $153,144 |
| 2015 | $2,905 | $237,040 | $86,196 | $150,844 |
| 2014 | $2,843 | $232,397 | $84,508 | $147,889 |
Source: Public Records
Map
Nearby Homes
- 326 Brentwood Dr
- 334 Brentwood Dr
- 38 Hazelwood Ct
- 760 Lake Village Dr
- 764 Lake Village Dr
- 329 Brentwood Dr
- 333 Brentwood Dr
- 34 Hazelwood Ct
- 325 Brentwood Dr
- 337 Brentwood Dr
- 105 Weeks Dr
- 768 Lake Village Dr
- 321 Brentwood Dr
- 341 Brentwood Dr
- 111 Weeks Dr
- 30 Hazelwood Ct
- 117 Weeks Dr
- 317 Brentwood Dr
- 334 Manor Ave
- 345 Brentwood Dr