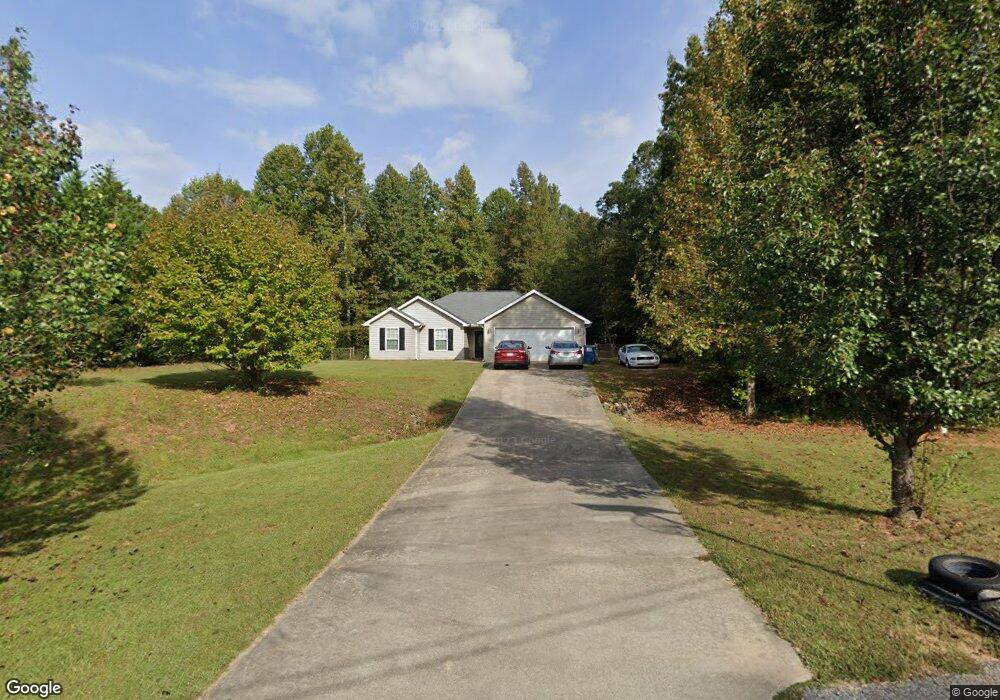
330 Cain Bridge Meadows Rd Demorest, GA 30535
Estimated Value: $286,000 - $300,225
3
Beds
2
Baths
1,402
Sq Ft
$209/Sq Ft
Est. Value
About This Home
This home is located at 330 Cain Bridge Meadows Rd, Demorest, GA 30535 and is currently estimated at $292,806, approximately $208 per square foot. 330 Cain Bridge Meadows Rd is a home located in Habersham County with nearby schools including Fairview Elementary School, North Habersham Middle School, and Habersham Success Academy.
Ownership History
Date
Name
Owned For
Owner Type
Purchase Details
Closed on
Dec 28, 2017
Sold by
Hunter Joshua S
Bought by
Harkins Raye and Umberhandt Ronald D
Current Estimated Value
Home Financials for this Owner
Home Financials are based on the most recent Mortgage that was taken out on this home.
Original Mortgage
$124,542
Outstanding Balance
$105,919
Interest Rate
4.25%
Mortgage Type
FHA
Estimated Equity
$186,887
Purchase Details
Closed on
Aug 26, 2014
Sold by
Gambill Teresa M
Bought by
Hook Heather A and Hunter Joshua S
Home Financials for this Owner
Home Financials are based on the most recent Mortgage that was taken out on this home.
Original Mortgage
$115,862
Interest Rate
4.25%
Mortgage Type
FHA
Purchase Details
Closed on
Oct 1, 2006
Sold by
Not Provided
Bought by
Gambill Teresa M
Create a Home Valuation Report for This Property
The Home Valuation Report is an in-depth analysis detailing your home's value as well as a comparison with similar homes in the area
Home Values in the Area
Average Home Value in this Area
Purchase History
| Date | Buyer | Sale Price | Title Company |
|---|---|---|---|
| Harkins Raye | $136,000 | -- | |
| Hook Heather A | $118,000 | -- | |
| Gambill Teresa M | $114,900 | -- |
Source: Public Records
Mortgage History
| Date | Status | Borrower | Loan Amount |
|---|---|---|---|
| Open | Harkins Raye | $124,542 | |
| Previous Owner | Hook Heather A | $115,862 |
Source: Public Records
Tax History
| Year | Tax Paid | Tax Assessment Tax Assessment Total Assessment is a certain percentage of the fair market value that is determined by local assessors to be the total taxable value of land and additions on the property. | Land | Improvement |
|---|---|---|---|---|
| 2025 | $2,787 | $115,384 | $16,000 | $99,384 |
| 2024 | $2,559 | $98,584 | $12,000 | $86,584 |
| 2023 | $2,457 | $98,264 | $12,000 | $86,264 |
| 2022 | $1,907 | $73,120 | $12,000 | $61,120 |
| 2021 | $1,726 | $66,496 | $12,000 | $54,496 |
| 2020 | $1,472 | $54,732 | $8,000 | $46,732 |
| 2019 | $1,474 | $54,732 | $8,000 | $46,732 |
| 2018 | $1,453 | $54,400 | $8,000 | $46,400 |
| 2017 | $1,329 | $49,484 | $8,000 | $41,484 |
| 2016 | $1,130 | $108,310 | $4,000 | $39,324 |
| 2015 | $1,116 | $108,310 | $4,000 | $39,324 |
| 2014 | $1,052 | $105,170 | $4,000 | $38,068 |
| 2013 | -- | $35,996 | $4,000 | $31,996 |
Source: Public Records
Map
Nearby Homes
- 257 Iris Dr
- 1772 Highway 115
- 0 Wheeler Rd Unit 22579726
- 132 Fairview Meadows Dr
- 152 Grover Taylor Rd
- 1045 Fairview School Rd
- 236 Fairview Ct
- 549 Garrett Rd
- 7 ACRES Wheeler Rd
- 188 Jim Thomas Rd
- 186 Sweetbriar Dr Unit LOT 10
- 186 Sweetbriar Dr
- 0000 Twin River Orchard Rd
- 0 Twin River Orchard Rd Unit TRACT 4
- 00000 Twin River Orchard Rd
- 0 Twin River Orchard Rd Unit TRACT 1
- 000 Twin River Orchard Rd
- 0 Twin River Orchard Rd Unit TRACT 3
- 0 Twin River Orchard Rd Unit TRACT 2
- 00 Twin River Orchard Rd
- 330 Cainbridge Meadows
- 320 Cain Bridge Meadows Rd
- 340 Cainbridge Meadows
- 349 Cain Bridge Meadows Rd Unit 26
- 349 Cainbridge Meadows Unit 26
- 349 Cainbridge Meadows
- 310 Cainbridge Meadows
- 321 Cainbridge Meadows
- 331 Cainbridge Meadows
- 300 Cainbridge Meadows
- 299 Cain Bridge Meadows Rd
- 299 Cainbridge Meadows
- 299 Cainbridge Meadows
- 244 Mcentire Rd
- 258 Mcentire Rd
- 230 Mcentire Rd
- 250 Cainbridge Meadows
- 265 Cain Bridge Meadows Rd Unit 22
- 292 Mcentire Rd
- 265 Cainbridge Meadows Unit 22
Your Personal Tour Guide
Ask me questions while you tour the home.