Estimated Value: $59,340 - $138,000
2
Beds
1
Bath
868
Sq Ft
$101/Sq Ft
Est. Value
About This Home
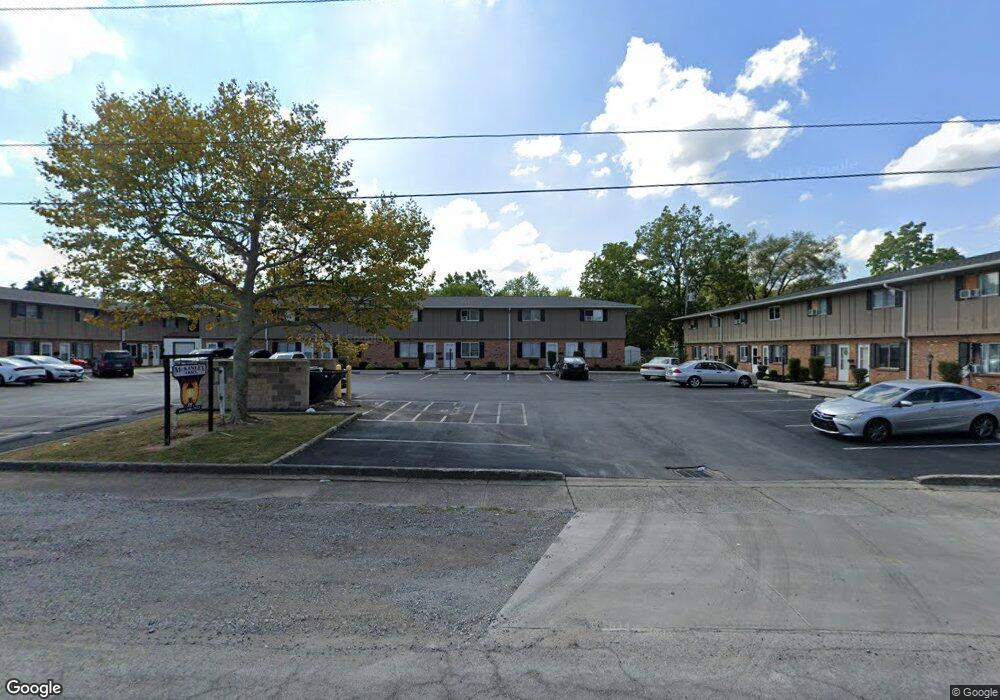
This home is located at 330 Calumet Ave, Lima, OH 45804 and is currently estimated at $87,335, approximately $100 per square foot. 330 Calumet Ave is a home located in Allen County with nearby schools including Freedom Elementary School, Lima North Middle School, and Lima West Middle School.
Ownership History
Date
Name
Owned For
Owner Type
Purchase Details
Closed on
Jan 12, 2018
Sold by
Fisher Investment Property Inc
Bought by
Creating Comfort Rentals Llc
Current Estimated Value
Home Financials for this Owner
Home Financials are based on the most recent Mortgage that was taken out on this home.
Original Mortgage
$1,200,000
Outstanding Balance
$323,139
Interest Rate
3.9%
Mortgage Type
Future Advance Clause Open End Mortgage
Estimated Equity
-$235,804
Purchase Details
Closed on
Jun 6, 2006
Sold by
Mid America Properties Inc
Bought by
Fisher Investment Property Inc
Home Financials for this Owner
Home Financials are based on the most recent Mortgage that was taken out on this home.
Original Mortgage
$1,000,000
Interest Rate
6.62%
Mortgage Type
Future Advance Clause Open End Mortgage
Purchase Details
Closed on
Jan 1, 1990
Bought by
Carma
Create a Home Valuation Report for This Property
The Home Valuation Report is an in-depth analysis detailing your home's value as well as a comparison with similar homes in the area
Home Values in the Area
Average Home Value in this Area
Purchase History
| Date | Buyer | Sale Price | Title Company |
|---|---|---|---|
| Creating Comfort Rentals Llc | $760,000 | None Available | |
| Fisher Investment Property Inc | $637,000 | None Available | |
| Carma | -- | -- |
Source: Public Records
Mortgage History
| Date | Status | Borrower | Loan Amount |
|---|---|---|---|
| Open | Creating Comfort Rentals Llc | $1,200,000 | |
| Previous Owner | Fisher Investment Property Inc | $1,000,000 |
Source: Public Records
Tax History Compared to Growth
Tax History
| Year | Tax Paid | Tax Assessment Tax Assessment Total Assessment is a certain percentage of the fair market value that is determined by local assessors to be the total taxable value of land and additions on the property. | Land | Improvement |
|---|---|---|---|---|
| 2024 | $320 | $8,120 | $1,120 | $7,000 |
| 2023 | $328 | $7,290 | $1,020 | $6,270 |
| 2022 | $329 | $7,290 | $1,020 | $6,270 |
| 2021 | $348 | $7,290 | $1,020 | $6,270 |
| 2020 | $372 | $7,670 | $1,020 | $6,650 |
| 2019 | $372 | $7,670 | $1,020 | $6,650 |
| 2018 | $370 | $7,670 | $1,020 | $6,650 |
| 2017 | $373 | $7,670 | $1,020 | $6,650 |
| 2016 | $380 | $7,670 | $1,020 | $6,650 |
| 2015 | $389 | $7,670 | $1,020 | $6,650 |
| 2014 | $397 | $7,910 | $770 | $7,140 |
| 2013 | $388 | $7,910 | $770 | $7,140 |
Source: Public Records
Map
Nearby Homes
- 520 Orena Ave
- 620 E Elm St Unit 1/2
- 806 Bellefontaine Ave
- 00 Bellefontaine Ave
- 706 E Kibby St
- 145 S Pine St
- 380 S Pine St
- 129 S Pine St
- 524 S Collins Ave
- 600 Dingledine Ave
- 4 package Rentals
- 306 E Vine St
- 839 Saint Johns Ave
- 1093 S Sugar St
- 439 E Mckibben St
- 1008 Fairview Ave
- 622 N Jefferson St
- 11 Unit Multi Family and Sfh
- 1100 Saint Johns Ave
- 14 House Package
- 330 Calumet Ave
- 330 Calumet Ave
- 330 Calumet Ave
- 330 Calumet Ave
- 330 Calumet Ave
- 330 Calumet Ave
- 330 Calumet Ave
- 330 Calumet Ave
- 330 Calumet Ave
- 330 Calumet Ave
- 330 Calumet Ave
- 330 Calumet Ave
- 330 Calumet Ave
- 330 Calumet Ave
- 330 Calumet Ave
- 330 Calumet Ave
- 330 Calumet Ave
- 330 Calumet Ave
- 330 Calumet Ave