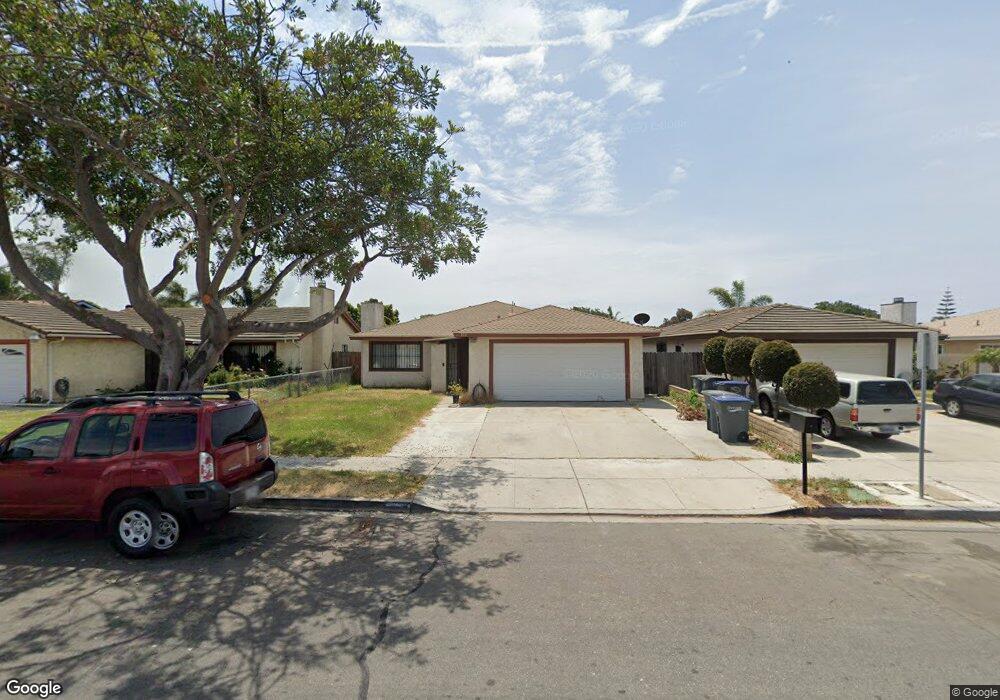
330 Campbell Way Oxnard, CA 93033
South Winds NeighborhoodEstimated Value: $655,215 - $875,000
4
Beds
2
Baths
1,576
Sq Ft
$476/Sq Ft
Est. Value
About This Home
This home is located at 330 Campbell Way, Oxnard, CA 93033 and is currently estimated at $749,554, approximately $475 per square foot. 330 Campbell Way is a home located in Ventura County with nearby schools including Art Haycox Elementary School and Hueneme High School.
Ownership History
Date
Name
Owned For
Owner Type
Purchase Details
Closed on
Jul 19, 2007
Sold by
Souths Joe and Southaphanh Monh
Bought by
Souths Joe and Southaphanh Monh
Current Estimated Value
Purchase Details
Closed on
Dec 2, 1993
Sold by
South Joe and Southaphanh Souths
Bought by
Souths Joe and Southaphanh Monh
Home Financials for this Owner
Home Financials are based on the most recent Mortgage that was taken out on this home.
Original Mortgage
$75,000
Interest Rate
6.43%
Create a Home Valuation Report for This Property
The Home Valuation Report is an in-depth analysis detailing your home's value as well as a comparison with similar homes in the area
Home Values in the Area
Average Home Value in this Area
Purchase History
| Date | Buyer | Sale Price | Title Company |
|---|---|---|---|
| Souths Joe | -- | None Available | |
| Souths Joe | -- | Fidelity National Title |
Source: Public Records
Mortgage History
| Date | Status | Borrower | Loan Amount |
|---|---|---|---|
| Closed | Souths Joe | $75,000 |
Source: Public Records
Tax History Compared to Growth
Tax History
| Year | Tax Paid | Tax Assessment Tax Assessment Total Assessment is a certain percentage of the fair market value that is determined by local assessors to be the total taxable value of land and additions on the property. | Land | Improvement |
|---|---|---|---|---|
| 2025 | $2,703 | $223,964 | $78,381 | $145,583 |
| 2024 | $2,703 | $219,573 | $76,844 | $142,729 |
| 2023 | $2,545 | $215,268 | $75,337 | $139,931 |
| 2022 | $2,493 | $211,048 | $73,860 | $137,188 |
| 2021 | $2,524 | $206,910 | $72,411 | $134,499 |
| 2020 | $2,570 | $204,790 | $71,669 | $133,121 |
| 2019 | $2,494 | $200,775 | $70,264 | $130,511 |
| 2018 | $2,403 | $196,839 | $68,887 | $127,952 |
| 2017 | $2,325 | $192,981 | $67,537 | $125,444 |
| 2016 | $2,216 | $189,198 | $66,213 | $122,985 |
| 2015 | $2,250 | $186,358 | $65,219 | $121,139 |
| 2014 | $2,209 | $182,710 | $63,943 | $118,767 |
Source: Public Records
Map
Nearby Homes
- 507 Batten Ln
- 5233 Perkins Rd
- 5302 Barrymore Dr
- 5225 Columbus Place
- 341 Cuesta Del Mar Dr
- 541 Cuesta Del Mar Dr
- 5170 Edgar St
- 4811 S G St
- 5420 S J St
- 912 Maplewood Way
- 655 Dahl Ave
- 181 Courtyard Dr
- 168 Courtyard Dr
- 731 Florence Ave
- 117 Ann Ave
- 676 E Scott St
- 234 Johnson Rd
- 4029 S B St
- 4105 S J St
- 4010 S J St
- 340 Campbell Way
- 320 Campbell Way
- 310 Campbell Way
- 331 Fairbourne Place
- 321 Fairbourne Place
- 341 Fairbourne Place
- 400 Campbell Way
- 311 Fairbourne Place
- 300 Campbell Way
- 351 Fairbourne Place
- 321 Campbell Way
- 331 Campbell Way Unit 3
- 331 Campbell Way Unit 2
- 331 Campbell Way Unit 1
- 301 Fairbourne Place
- 311 Campbell Way Unit 3
- 311 Campbell Way
- 361 Fairbourne Place
- 341 Campbell Way
- 410 Campbell Way