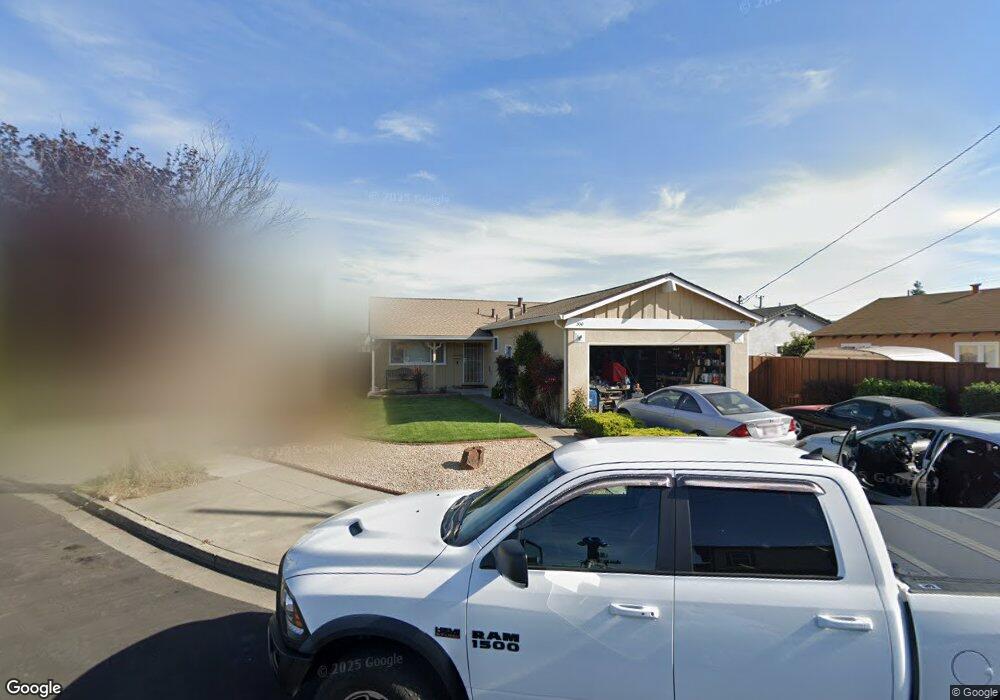
330 Carmar St Hayward, CA 94544
Tennyson-Alquire NeighborhoodEstimated Value: $789,000 - $890,000
3
Beds
2
Baths
1,160
Sq Ft
$716/Sq Ft
Est. Value
About This Home
This home is located at 330 Carmar St, Hayward, CA 94544 and is currently estimated at $830,154, approximately $715 per square foot. 330 Carmar St is a home located in Alameda County with nearby schools including Ruus Elementary School, Cesar Chavez Middle School, and Tennyson High School.
Ownership History
Date
Name
Owned For
Owner Type
Purchase Details
Closed on
Dec 12, 2017
Sold by
Noe Jack Curtis and The Magdalene M Noe Living Tru
Bought by
Noe Jack C
Current Estimated Value
Home Financials for this Owner
Home Financials are based on the most recent Mortgage that was taken out on this home.
Original Mortgage
$480,000
Outstanding Balance
$404,118
Interest Rate
3.94%
Mortgage Type
New Conventional
Estimated Equity
$426,036
Purchase Details
Closed on
Jan 15, 2007
Sold by
Noe Magdalene M
Bought by
The Magdalene M Noe Living Trust
Purchase Details
Closed on
Jun 15, 1994
Sold by
Noe Nelson C
Bought by
Noe Magdalene M
Home Financials for this Owner
Home Financials are based on the most recent Mortgage that was taken out on this home.
Original Mortgage
$100,000
Interest Rate
8.83%
Create a Home Valuation Report for This Property
The Home Valuation Report is an in-depth analysis detailing your home's value as well as a comparison with similar homes in the area
Home Values in the Area
Average Home Value in this Area
Purchase History
| Date | Buyer | Sale Price | Title Company |
|---|---|---|---|
| Noe Jack C | $600,000 | Fidelity National Title Comp | |
| The Magdalene M Noe Living Trust | -- | None Available | |
| Noe Magdalene M | -- | Fidelity National Title |
Source: Public Records
Mortgage History
| Date | Status | Borrower | Loan Amount |
|---|---|---|---|
| Open | Noe Jack C | $480,000 | |
| Previous Owner | Noe Magdalene M | $100,000 |
Source: Public Records
Tax History
| Year | Tax Paid | Tax Assessment Tax Assessment Total Assessment is a certain percentage of the fair market value that is determined by local assessors to be the total taxable value of land and additions on the property. | Land | Improvement |
|---|---|---|---|---|
| 2025 | $1,252 | $75,269 | $30,647 | $44,622 |
| 2024 | $1,252 | $73,793 | $30,046 | $43,747 |
| 2023 | $1,236 | $72,346 | $29,457 | $42,889 |
| 2022 | $1,217 | $70,928 | $28,879 | $42,049 |
| 2021 | $1,207 | $69,537 | $28,313 | $41,224 |
| 2020 | $1,197 | $68,825 | $28,023 | $40,802 |
| 2019 | $1,203 | $67,476 | $27,474 | $40,002 |
| 2018 | $1,147 | $66,152 | $26,935 | $39,217 |
| 2017 | $1,128 | $64,855 | $26,407 | $38,448 |
| 2016 | $1,045 | $63,584 | $25,889 | $37,695 |
| 2015 | $1,030 | $62,628 | $25,500 | $37,128 |
| 2014 | $992 | $61,402 | $25,001 | $36,401 |
Source: Public Records
Map
Nearby Homes
- 139 Mars Ave Unit 139
- 29026 Hillview St
- 29131 Delgado Rd
- 29138 Delgado Rd
- 29255 Harpoon Way
- 29133 De la Cruz Rd
- 29286 Whalebone Way
- 29273 Nantucket Way
- 28315 Rochelle Ave
- 28538 Huntwood Ave
- 933 New England Village Dr
- 29372 Providence Way Unit 111
- 29424 Providence Way
- 27777 Pistachio Ct
- 242 Bolt Ct
- 29428 Middleborough Way
- 27906 Thackeray Ave
- 27773 Pistachio Ct
- 29043 Windemere Rd
- 260 Industrial Pkwy Unit 47
- 308 Carmar St
- 28742 Triton St
- 28714 Triton St
- 377 Cooper Ave
- 28778 Roanoke St
- 283 Cooper Ave
- 28695 Roanoke St
- 28750 Roanoke St
- 251 Cooper Ave
- 28696 Triton St
- 28722 Roanoke St
- 219 Cooper Ave
- 28687 Roanoke St
- 28694 Roanoke St
- 28743 Triton St
- 28715 Triton St
- 28688 Triton St
- 28781 Triton St
- 28686 Roanoke St
Your Personal Tour Guide
Ask me questions while you tour the home.