Estimated Value: $407,127 - $485,000
3
Beds
1
Bath
1,092
Sq Ft
$402/Sq Ft
Est. Value
About This Home
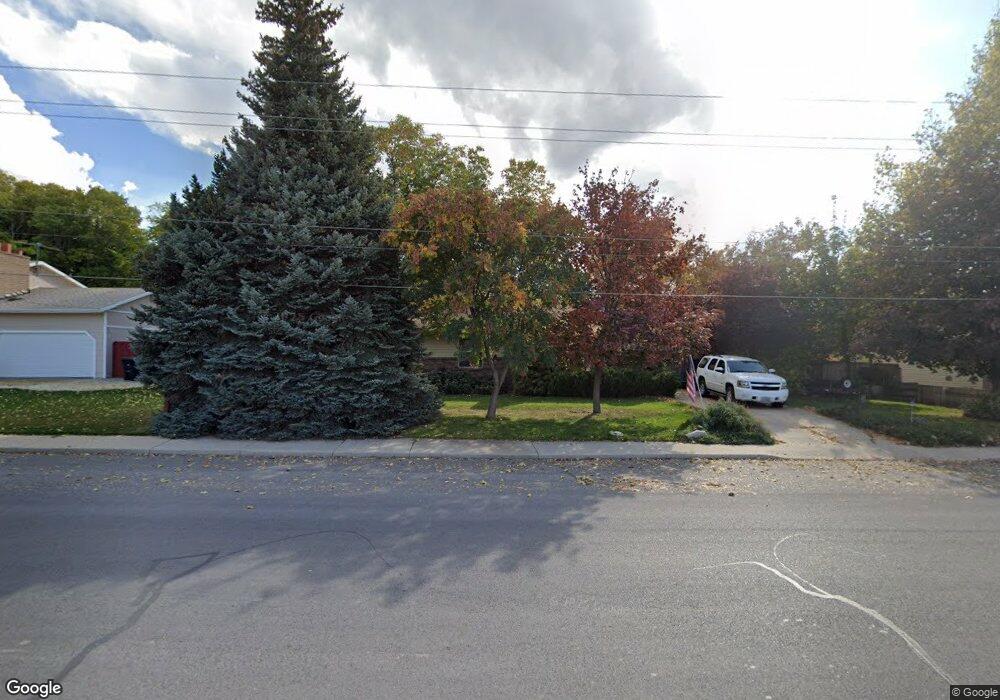
This home is located at 330 E 400 N, Salem, UT 84653 and is currently estimated at $438,709, approximately $401 per square foot. 330 E 400 N is a home located in Utah County with nearby schools including Salem Elementary, Salem Junior High School, and Valley View Middle School.
Ownership History
Date
Name
Owned For
Owner Type
Purchase Details
Closed on
Apr 22, 2022
Sold by
Jean Unger Riches Trust
Bought by
Jean Unger Riches Trust
Current Estimated Value
Home Financials for this Owner
Home Financials are based on the most recent Mortgage that was taken out on this home.
Original Mortgage
$150,000
Outstanding Balance
$140,290
Interest Rate
3.85%
Mortgage Type
New Conventional
Estimated Equity
$298,419
Purchase Details
Closed on
Dec 31, 2009
Sold by
Riches Jean U and Riches Jean
Bought by
Riches Jean Unger
Purchase Details
Closed on
Feb 1, 2001
Sold by
Riches Michael A
Bought by
Riches Jean U
Purchase Details
Closed on
Sep 25, 1997
Sold by
Wride David E and Wride Jeanie
Bought by
Riches Michael A
Home Financials for this Owner
Home Financials are based on the most recent Mortgage that was taken out on this home.
Original Mortgage
$93,500
Interest Rate
7.44%
Mortgage Type
Seller Take Back
Create a Home Valuation Report for This Property
The Home Valuation Report is an in-depth analysis detailing your home's value as well as a comparison with similar homes in the area
Home Values in the Area
Average Home Value in this Area
Purchase History
| Date | Buyer | Sale Price | Title Company |
|---|---|---|---|
| Jean Unger Riches Trust | -- | None Listed On Document | |
| Riches Jean Unger | -- | None Available | |
| Riches Jean U | -- | -- | |
| Riches Michael A | -- | -- |
Source: Public Records
Mortgage History
| Date | Status | Borrower | Loan Amount |
|---|---|---|---|
| Open | Jean Unger Riches Trust | $150,000 | |
| Previous Owner | Riches Michael A | $93,500 |
Source: Public Records
Tax History
| Year | Tax Paid | Tax Assessment Tax Assessment Total Assessment is a certain percentage of the fair market value that is determined by local assessors to be the total taxable value of land and additions on the property. | Land | Improvement |
|---|---|---|---|---|
| 2025 | $1,682 | $192,335 | -- | -- |
| 2024 | $1,682 | $170,610 | $0 | $0 |
| 2023 | $1,620 | $164,615 | $0 | $0 |
| 2022 | $1,564 | $156,475 | $0 | $0 |
| 2021 | $1,232 | $197,700 | $91,500 | $106,200 |
| 2020 | $1,174 | $183,400 | $83,200 | $100,200 |
| 2019 | $1,045 | $166,700 | $79,600 | $87,100 |
| 2018 | $972 | $148,100 | $72,400 | $75,700 |
| 2017 | $876 | $71,225 | $0 | $0 |
| 2016 | $788 | $63,305 | $0 | $0 |
| 2015 | $725 | $57,200 | $0 | $0 |
| 2014 | $678 | $53,625 | $0 | $0 |
Source: Public Records
Map
Nearby Homes
- 1223 N 360 E Unit 129
- 1212 N 360 E Unit 132
- 1195 N 360 E Unit 127
- 1241 N 360 E Unit 130
- 1238 N 360 E Unit 133
- 1207 N 360 E Unit 128
- 1165 N 360 E Unit 75
- 432 E 300 N Unit 12
- 453 N 460 E
- 315 N 500 E
- 443 N 500 E Unit LOT 2
- 644 N 500 E Unit 111
- 513 E 400 North St
- 846 E 400 St N
- 453 N 500 E Unit LOT 3
- 465 N 500 E Unit LOT 4
- 481 N 500 E Unit LOT 5
- 475 E 500 N Unit LOT 22
- 438 N 500 E Unit LOT 2
- 647-1208 N 1850 E
Your Personal Tour Guide
Ask me questions while you tour the home.