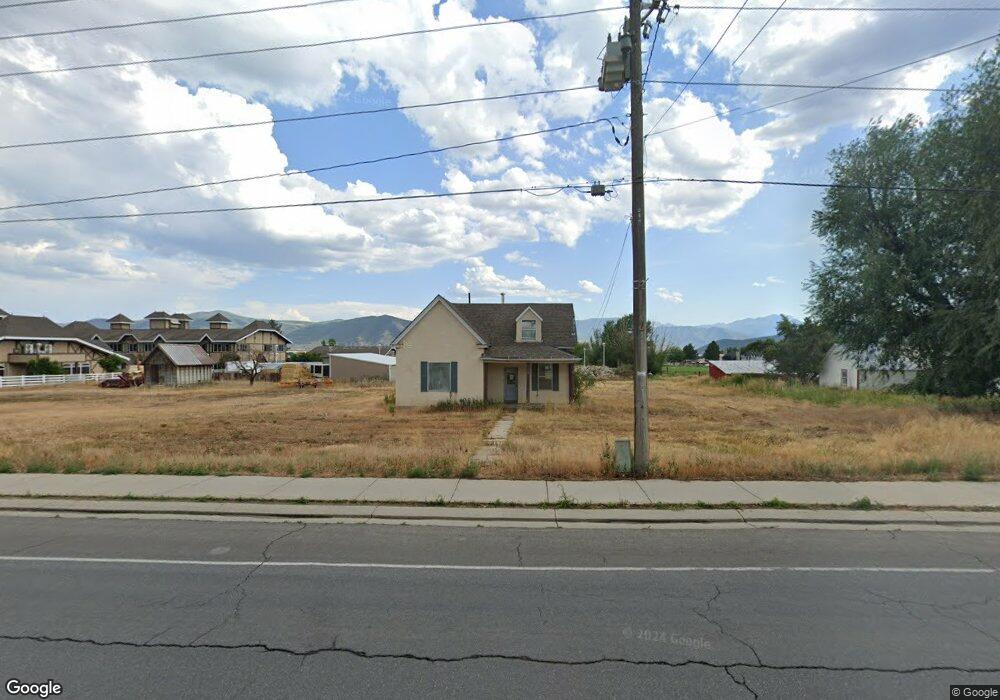
330 E Main St Midway, UT 84049
Estimated Value: $906,000 - $1,038,000
3
Beds
2
Baths
1,775
Sq Ft
$542/Sq Ft
Est. Value
About This Home
This home is located at 330 E Main St, Midway, UT 84049 and is currently estimated at $961,867, approximately $541 per square foot. 330 E Main St is a home located in Wasatch County with nearby schools including Midway Elementary School, Rocky Mountain Middle School, and Wasatch High School.
Ownership History
Date
Name
Owned For
Owner Type
Purchase Details
Closed on
Dec 20, 2024
Sold by
Midway Main Street Holdings Llc
Bought by
Red Wagon Ventures Llc
Current Estimated Value
Purchase Details
Closed on
Dec 17, 2020
Sold by
Clydco Holdings Inc
Bought by
Midway Main Street Holdings Llc
Purchase Details
Closed on
Apr 15, 2019
Sold by
Trinity Properties Llc
Bought by
Clydco Holdings Inc
Purchase Details
Closed on
Aug 15, 1998
Sold by
Hadlock Richard A and Hadlock Sylvia
Bought by
Trinity Properties Llc
Create a Home Valuation Report for This Property
The Home Valuation Report is an in-depth analysis detailing your home's value as well as a comparison with similar homes in the area
Home Values in the Area
Average Home Value in this Area
Purchase History
| Date | Buyer | Sale Price | Title Company |
|---|---|---|---|
| Red Wagon Ventures Llc | -- | Atlas Title | |
| Red Wagon Ventures Llc | -- | Atlas Title | |
| Midway Main Street Holdings Llc | -- | None Available | |
| Clydco Holdings Inc | -- | Meridian Title Company | |
| Trinity Properties Llc | -- | None Available |
Source: Public Records
Tax History
| Year | Tax Paid | Tax Assessment Tax Assessment Total Assessment is a certain percentage of the fair market value that is determined by local assessors to be the total taxable value of land and additions on the property. | Land | Improvement |
|---|---|---|---|---|
| 2025 | $4,981 | $540,500 | $300,000 | $240,500 |
| 2024 | $4,327 | $540,500 | $300,000 | $240,500 |
| 2023 | $4,327 | $592,625 | $200,000 | $392,625 |
| 2022 | $5,942 | $592,625 | $200,000 | $392,625 |
| 2021 | $5,591 | $430,922 | $200,000 | $230,922 |
| 2020 | $3,419 | $221,706 | $95,000 | $126,706 |
| 2019 | $2,713 | $221,706 | $0 | $0 |
| 2018 | $1,492 | $121,938 | $0 | $0 |
| 2017 | $1,396 | $113,380 | $0 | $0 |
| 2016 | $1,431 | $113,380 | $0 | $0 |
| 2015 | $1,360 | $113,380 | $0 | $0 |
| 2014 | $1,415 | $113,380 | $0 | $0 |
Source: Public Records
Map
Nearby Homes
Your Personal Tour Guide
Ask me questions while you tour the home.