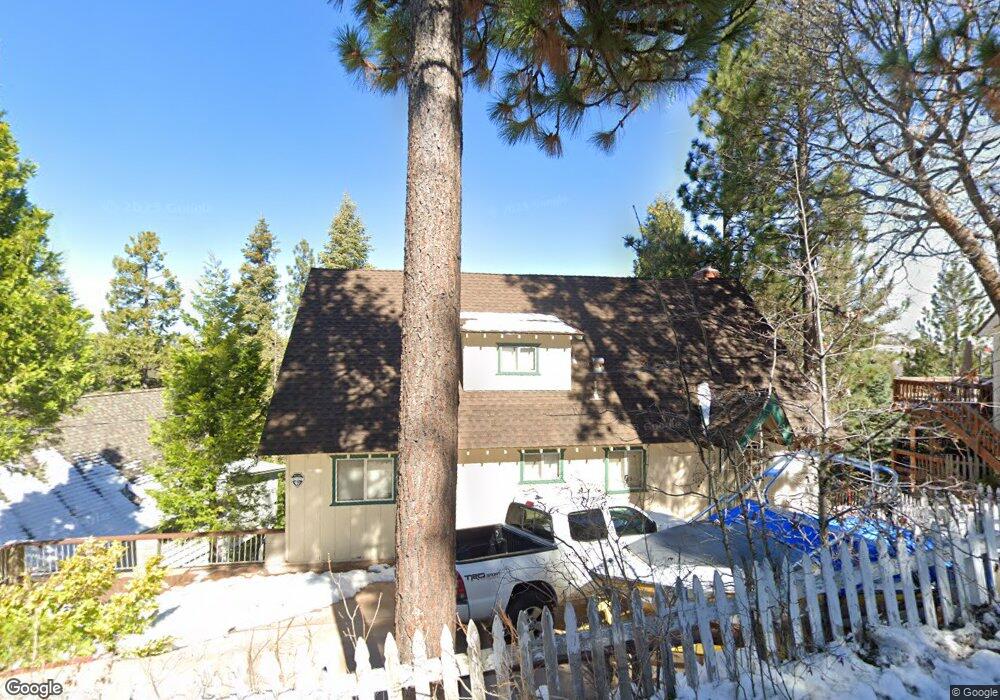
330 Emerald Dr Lake Arrowhead, CA 92352
Estimated Value: $706,211 - $858,000
4
Beds
3
Baths
1,734
Sq Ft
$455/Sq Ft
Est. Value
About This Home
This home is located at 330 Emerald Dr, Lake Arrowhead, CA 92352 and is currently estimated at $788,803, approximately $454 per square foot. 330 Emerald Dr is a home located in San Bernardino County with nearby schools including Lake Arrowhead Elementary School, Mary P. Henck Intermediate School, and Rim Of The World Senior High School.
Ownership History
Date
Name
Owned For
Owner Type
Purchase Details
Closed on
Apr 13, 2013
Sold by
Scollard Duane J
Bought by
Scollard Duane J and Duane J Scollard Trust
Current Estimated Value
Purchase Details
Closed on
Sep 14, 2011
Sold by
Mckinnon Neil J and Mc Kinnon Lynda L
Bought by
Scollard Duane J
Purchase Details
Closed on
Apr 19, 1998
Sold by
Kassabian John P and Kassabian Mary
Bought by
Mckinnon Neil J and Mckinnon Lynda L
Home Financials for this Owner
Home Financials are based on the most recent Mortgage that was taken out on this home.
Original Mortgage
$137,600
Interest Rate
7.13%
Purchase Details
Closed on
Mar 21, 1995
Sold by
Kassabiaan John P and Kassabian Mary
Bought by
Kassabian John Paul and Kassabian Mary
Create a Home Valuation Report for This Property
The Home Valuation Report is an in-depth analysis detailing your home's value as well as a comparison with similar homes in the area
Home Values in the Area
Average Home Value in this Area
Purchase History
| Date | Buyer | Sale Price | Title Company |
|---|---|---|---|
| Scollard Duane J | -- | None Available | |
| Scollard Duane J | $380,000 | Stewart Title Company | |
| Mckinnon Neil J | $172,000 | Commonwealth Land Title Co | |
| Kassabian John Paul | -- | -- |
Source: Public Records
Mortgage History
| Date | Status | Borrower | Loan Amount |
|---|---|---|---|
| Previous Owner | Mckinnon Neil J | $137,600 |
Source: Public Records
Tax History
| Year | Tax Paid | Tax Assessment Tax Assessment Total Assessment is a certain percentage of the fair market value that is determined by local assessors to be the total taxable value of land and additions on the property. | Land | Improvement |
|---|---|---|---|---|
| 2025 | $5,579 | $477,304 | $57,277 | $420,027 |
| 2024 | $5,285 | $467,945 | $56,154 | $411,791 |
| 2023 | $5,233 | $458,770 | $55,053 | $403,717 |
| 2022 | $5,127 | $449,775 | $53,974 | $395,801 |
| 2021 | $5,070 | $440,956 | $52,916 | $388,040 |
| 2020 | $5,071 | $436,434 | $52,373 | $384,061 |
| 2019 | $4,940 | $427,876 | $51,346 | $376,530 |
| 2018 | $4,890 | $419,486 | $50,339 | $369,147 |
| 2017 | $4,802 | $411,261 | $49,352 | $361,909 |
| 2016 | $4,711 | $403,197 | $48,384 | $354,813 |
| 2015 | $4,804 | $397,140 | $47,657 | $349,483 |
| 2014 | $4,589 | $389,360 | $46,723 | $342,637 |
Source: Public Records
Map
Nearby Homes
- 347 Emerald Dr
- 29038 Terrace
- 417 Emerald Way
- 0 Ponderosa Unit 25524469
- 0 Ponderosa Unit 25524475
- 0 Ponderosa Unit 25524225
- 29083 Hook Creek Rd
- 0 Walnut Dr Unit SR25145729
- 0 Walnut Dr Unit IV25090974
- 28886 Cedar Dr
- 196 Ponderosa Dr
- 417 Emerald Dr
- 28999 Cedar Terrace
- 197 Western Dr
- 28774 Palisades Dr
- 29186 Arrowhead Dr
- 0 Hook Creek Rd
- 0000 Arrowhead Dr
- 496 California 173
- 658 Maple Dr
- 340 Emerald Ave
- 338 Emerald Dr
- 343 Old Mill Rd
- 341 Emerald Dr
- 331 Emerald Ave
- 0 Old Mill Dr Unit 210002090
- 0 Old Mill Dr
- 340 Emerald Dr
- 349 Old Mill Dr
- 441 Emerald Dr
- 304 Emerald Dr
- 349 Mill Rd
- 347 Emerald Ave
- 345 Emerald Dr
- 344 Emerald Dr
- 333 Emerald Dr
- 344 State Hwy
- 323 Mill Rd
- 337 Emerald Dr
- 344 Old Mill Rd
Your Personal Tour Guide
Ask me questions while you tour the home.