Estimated Value: $568,000 - $595,000
3
Beds
3
Baths
1,446
Sq Ft
$400/Sq Ft
Est. Value
About This Home
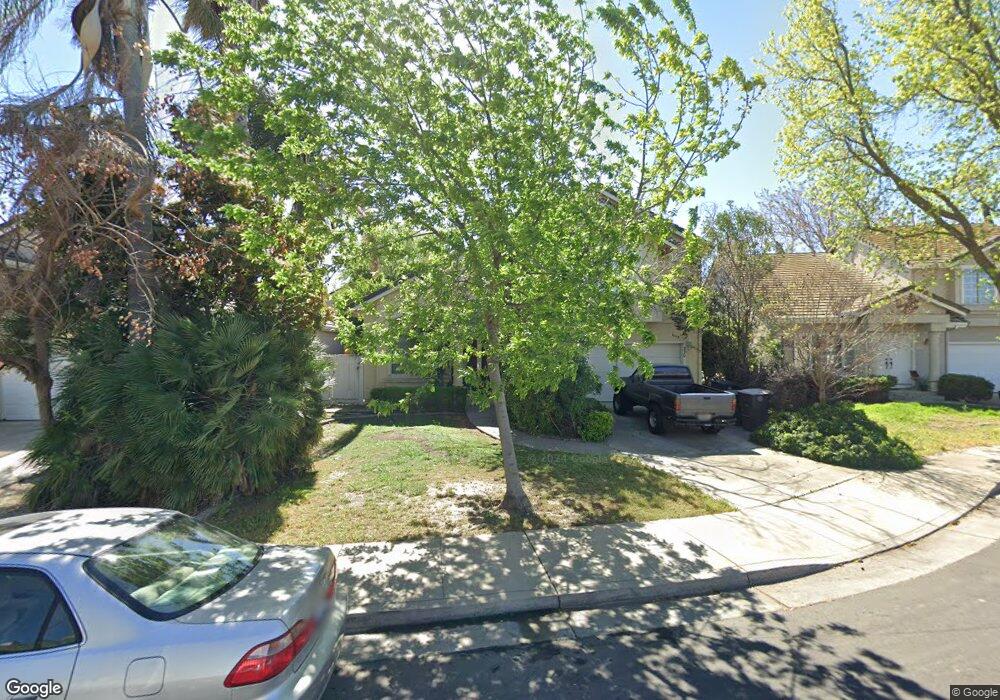
This home is located at 330 Falcon Ct, Tracy, CA 95376 and is currently estimated at $578,928, approximately $400 per square foot. 330 Falcon Ct is a home located in San Joaquin County with nearby schools including Louis A. Bohn Elementary School, Earle E. Williams Middle School, and Tracy High School.
Ownership History
Date
Name
Owned For
Owner Type
Purchase Details
Closed on
Apr 20, 2004
Sold by
Wilcox Irene
Bought by
Mendez Richard
Current Estimated Value
Home Financials for this Owner
Home Financials are based on the most recent Mortgage that was taken out on this home.
Original Mortgage
$288,000
Outstanding Balance
$133,067
Interest Rate
5.4%
Mortgage Type
Purchase Money Mortgage
Estimated Equity
$445,861
Purchase Details
Closed on
Apr 27, 2000
Sold by
Mendez Gil David and Mendez Leonor
Bought by
Wilcox Irene
Create a Home Valuation Report for This Property
The Home Valuation Report is an in-depth analysis detailing your home's value as well as a comparison with similar homes in the area
Home Values in the Area
Average Home Value in this Area
Purchase History
| Date | Buyer | Sale Price | Title Company |
|---|---|---|---|
| Mendez Richard | $360,000 | Fidelity Natl Title Ins Co | |
| Wilcox Irene | $224,000 | Old Republic Title Company |
Source: Public Records
Mortgage History
| Date | Status | Borrower | Loan Amount |
|---|---|---|---|
| Open | Mendez Richard | $288,000 | |
| Closed | Mendez Richard | $72,000 |
Source: Public Records
Tax History
| Year | Tax Paid | Tax Assessment Tax Assessment Total Assessment is a certain percentage of the fair market value that is determined by local assessors to be the total taxable value of land and additions on the property. | Land | Improvement |
|---|---|---|---|---|
| 2025 | $6,035 | $511,818 | $153,543 | $358,275 |
| 2024 | $5,570 | $501,783 | $150,533 | $351,250 |
| 2023 | $5,478 | $491,945 | $147,582 | $344,363 |
| 2022 | $5,365 | $482,300 | $144,689 | $337,611 |
| 2021 | $5,297 | $472,844 | $141,852 | $330,992 |
| 2020 | $5,260 | $467,997 | $140,398 | $327,599 |
| 2019 | $5,173 | $458,822 | $137,646 | $321,176 |
| 2018 | $5,325 | $449,827 | $134,948 | $314,879 |
| 2017 | $4,849 | $420,000 | $126,000 | $294,000 |
| 2016 | $4,376 | $365,000 | $110,000 | $255,000 |
| 2014 | $3,601 | $304,000 | $91,000 | $213,000 |
Source: Public Records
Map
Nearby Homes
- 320 Accipiter Ct
- 243 E 3rd St
- 18 W 8th St
- 60 W South St
- 125 E 12th St
- 448 Burlington Dr
- 515 Peerless Way Unit 13
- 166 Norman Ct
- 206 W 12th St
- 1110 Amaretto Dr
- 145 Machado Ct
- 920 Taft Ave
- 319 W 12th St
- 25820 S Macarthur Dr
- 143 W Beverly Place
- 1624 Badger Way
- 1704 East St
- 1636 Parker Ave
- 829 Palm Cir
- 740 Sequoia Blvd
Your Personal Tour Guide
Ask me questions while you tour the home.