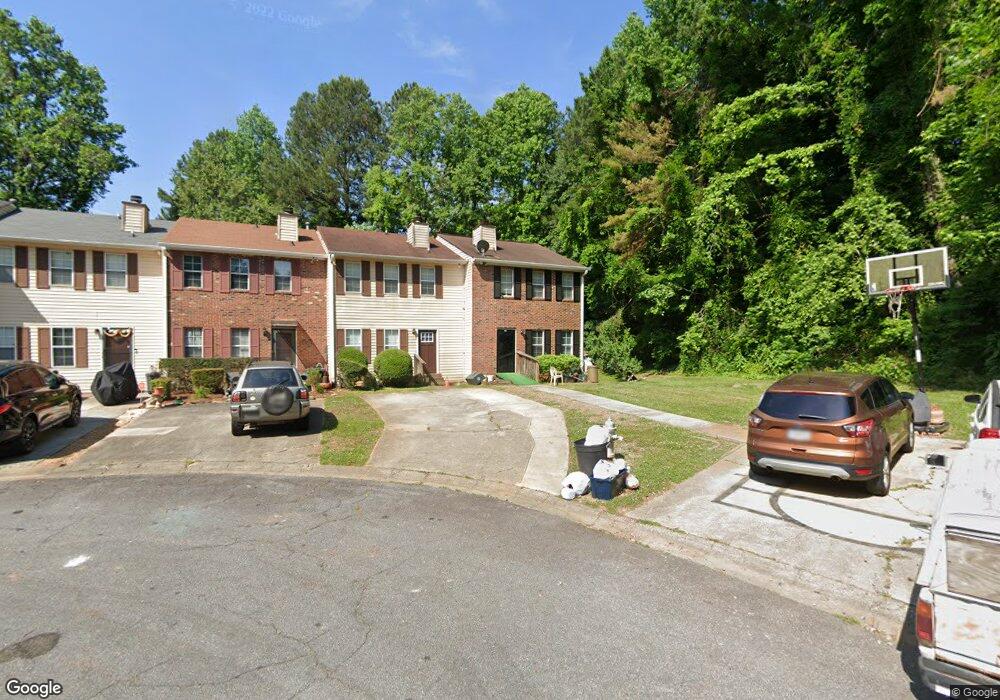
330 Hamilton Ct Unit II Marietta, GA 30068
Eastern Marietta NeighborhoodEstimated Value: $245,000 - $265,421
3
Beds
3
Baths
1,344
Sq Ft
$189/Sq Ft
Est. Value
About This Home
This home is located at 330 Hamilton Ct Unit II, Marietta, GA 30068 and is currently estimated at $254,105, approximately $189 per square foot. 330 Hamilton Ct Unit II is a home located in Cobb County with nearby schools including Marietta Sixth Grade Academy, Lockheed Elementary School, and Marietta Middle School.
Ownership History
Date
Name
Owned For
Owner Type
Purchase Details
Closed on
Jan 4, 2024
Sold by
Greene Kamau
Bought by
Greene Zuri
Current Estimated Value
Home Financials for this Owner
Home Financials are based on the most recent Mortgage that was taken out on this home.
Original Mortgage
$198,921
Outstanding Balance
$195,484
Interest Rate
7.29%
Mortgage Type
FHA
Estimated Equity
$58,621
Purchase Details
Closed on
May 18, 2023
Sold by
Simon Timothy J
Bought by
Greene Kamau
Purchase Details
Closed on
Mar 8, 2021
Sold by
Simon Timothy J and Gardner Barbara Ann
Bought by
Simon Timothy J
Purchase Details
Closed on
Oct 30, 1998
Sold by
Stein Steven B
Bought by
Simon Timothy and Gardner Ba
Home Financials for this Owner
Home Financials are based on the most recent Mortgage that was taken out on this home.
Original Mortgage
$71,835
Interest Rate
6.65%
Mortgage Type
FHA
Create a Home Valuation Report for This Property
The Home Valuation Report is an in-depth analysis detailing your home's value as well as a comparison with similar homes in the area
Home Values in the Area
Average Home Value in this Area
Purchase History
| Date | Buyer | Sale Price | Title Company |
|---|---|---|---|
| Greene Zuri | $230,000 | None Listed On Document | |
| Greene Kamau | -- | None Listed On Document | |
| Greene Kamau | -- | None Listed On Document | |
| Simon Timothy J | -- | None Available | |
| Simon Timothy | $72,000 | -- |
Source: Public Records
Mortgage History
| Date | Status | Borrower | Loan Amount |
|---|---|---|---|
| Open | Greene Zuri | $198,921 | |
| Previous Owner | Simon Timothy | $71,835 |
Source: Public Records
Tax History Compared to Growth
Tax History
| Year | Tax Paid | Tax Assessment Tax Assessment Total Assessment is a certain percentage of the fair market value that is determined by local assessors to be the total taxable value of land and additions on the property. | Land | Improvement |
|---|---|---|---|---|
| 2025 | $813 | $96,048 | $34,000 | $62,048 |
| 2024 | $813 | $96,048 | $34,000 | $62,048 |
| 2023 | $0 | $96,048 | $34,000 | $62,048 |
| 2022 | $83 | $69,708 | $10,000 | $59,708 |
| 2021 | $88 | $58,404 | $10,000 | $48,404 |
| 2020 | $88 | $58,404 | $10,000 | $48,404 |
| 2019 | $88 | $58,404 | $10,000 | $48,404 |
| 2018 | $86 | $48,080 | $8,000 | $40,080 |
| 2017 | $69 | $39,772 | $6,000 | $33,772 |
| 2016 | $69 | $39,772 | $6,000 | $33,772 |
| 2015 | $4 | $22,408 | $4,000 | $18,408 |
| 2014 | $5 | $22,408 | $0 | $0 |
Source: Public Records
Map
Nearby Homes
- 332 Hamilton Trace
- 1445 Varner Rd
- 0 Shadowbrook Dr Unit 10506866
- 0 Shadowbrook Dr Unit 7564152
- 1821 Clearwater Dr SE
- 141 Powers Ferry Rd SE
- 57 Sewell Ln
- 185 Herbert Dr SE
- 1394 Dewberry Trail
- 1785 Crestridge Dr SE
- 1923 Clearwater Dr SE
- 1824 Crestridge Dr SE
- 229 Mathews Cir SE
- 201 Hunting Creek Dr
- 201 Hunting Creek Dr Unit LotWP001
- 1722 Crestridge Dr SE
- 349 Virginia Place SE
- 1664 Crestridge Dr SE
- 369 Virginia Place SE
- 361 Clear Spring Ct
- 340 Hamilton Ct
- 350 Hamilton Ct Unit II
- 360 Hamilton Ct
- 370 Hamilton Ct
- 365 Hamilton Ct
- 345 Hamilton Ct Unit 2
- 335 Hamilton Ct
- 325 Hamilton Ct Unit 2
- 335 Hamilton Ct Unit 2
- 315 Hamilton Ct Unit 2
- 355 Hamilton Ct Unit 2
- 305 Hamilton Ct Unit 20
- 305 Hamilton Ct
- 295 Hamilton Ct
- 285 Hamilton Ct
- 275 Hamilton Ct Unit 2
- 265 Hamilton Ct
- 1686 Roswell Rd Unit B-1
- 1686 Roswell Rd
- 402 Hamilton Trace