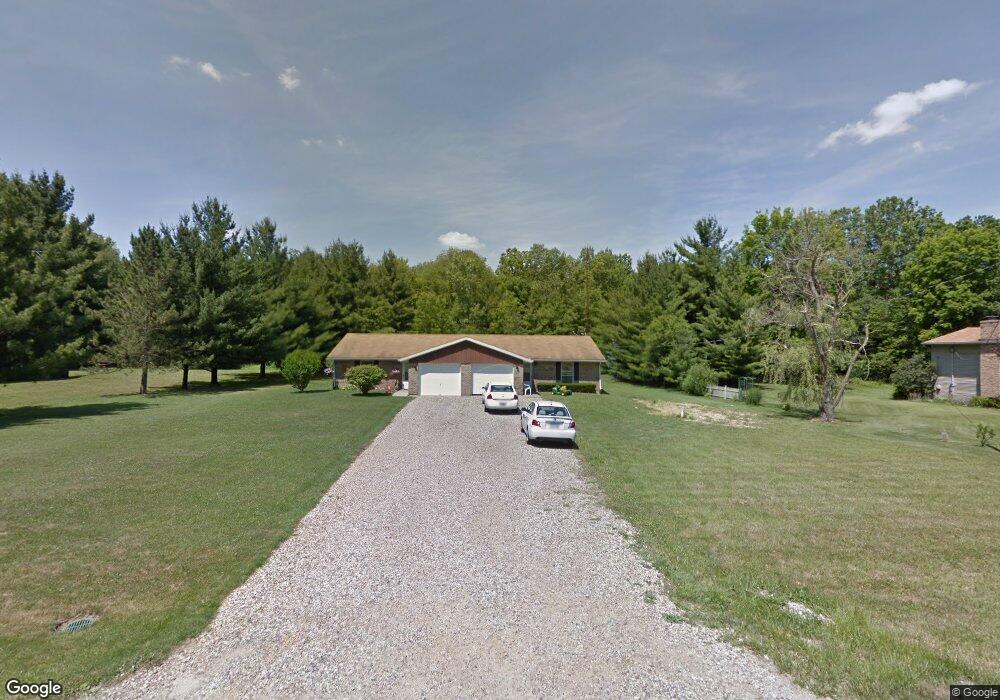
330 Marcus St Unit 332 Mansfield, OH 44903
Estimated Value: $192,291 - $229,000
4
Beds
2
Baths
1,780
Sq Ft
$118/Sq Ft
Est. Value
About This Home
This home is located at 330 Marcus St Unit 332, Mansfield, OH 44903 and is currently estimated at $210,073, approximately $118 per square foot. 330 Marcus St Unit 332 is a home located in Richland County with nearby schools including Stingel Elementary School, Ontario Middle School, and Ontario High School.
Ownership History
Date
Name
Owned For
Owner Type
Purchase Details
Closed on
Oct 4, 2019
Sold by
Rini Victor E and Rini Sandra L
Bought by
Black Dog Rentals Llc
Current Estimated Value
Purchase Details
Closed on
Feb 25, 2014
Sold by
Black Dog Rentals Llc
Bought by
Rini Victor E and Rini Sandra L
Purchase Details
Closed on
Aug 25, 1992
Sold by
Peay Elbert O
Bought by
Peay Elbert O
Create a Home Valuation Report for This Property
The Home Valuation Report is an in-depth analysis detailing your home's value as well as a comparison with similar homes in the area
Home Values in the Area
Average Home Value in this Area
Purchase History
| Date | Buyer | Sale Price | Title Company |
|---|---|---|---|
| Black Dog Rentals Llc | -- | None Available | |
| Rini Victor E | -- | Attorney | |
| Peay Elbert O | -- | -- |
Source: Public Records
Tax History Compared to Growth
Tax History
| Year | Tax Paid | Tax Assessment Tax Assessment Total Assessment is a certain percentage of the fair market value that is determined by local assessors to be the total taxable value of land and additions on the property. | Land | Improvement |
|---|---|---|---|---|
| 2024 | $2,371 | $46,540 | $9,030 | $37,510 |
| 2023 | $2,371 | $46,540 | $9,030 | $37,510 |
| 2022 | $2,222 | $37,560 | $8,210 | $29,350 |
| 2021 | $2,226 | $37,560 | $8,210 | $29,350 |
| 2020 | $2,377 | $37,560 | $8,210 | $29,350 |
| 2019 | $2,225 | $31,820 | $6,950 | $24,870 |
| 2018 | $1,897 | $31,820 | $6,950 | $24,870 |
| 2017 | $1,878 | $31,820 | $6,950 | $24,870 |
| 2016 | $1,889 | $32,000 | $6,740 | $25,260 |
| 2015 | $1,887 | $32,000 | $6,740 | $25,260 |
| 2014 | $1,891 | $32,000 | $6,740 | $25,260 |
| 2012 | $1,776 | $32,990 | $6,950 | $26,040 |
Source: Public Records
Map
Nearby Homes
- 2908 Millsboro Rd E
- 2735 Millsboro Rd E
- 436 Joy Lynn Ln
- 3320 Oakstone Dr
- 3308 Park Ave W
- 3458 Ridgestone Dr
- 3516 Muirfield Dr
- 3436 Ridgestone Ct
- 3516 Muirfield
- 2438 Millsboro Rd
- 295 Meadowlark Dr
- 3541 Oakstone Dr
- 63 Chambers Rd
- 230 Clare Rd
- 125 Hilltop Rd
- 56 Lexington Ontario Rd
- 445 Rudy Rd
- 2281 Park Ave W
- 0 Rudy Rd
- 0 Alexander Dr
- 320 Marcus St
- 340 Marcus St
- 335 Marcus St
- 325 Marcus St
- 345 Marcus St
- 350 Marcus St Unit 352
- 355 Marcus St
- 385 Marcus St
- 3070 Blair Ave
- 3050 Blair Ave
- 3060 Blair Ave
- 401 Marcus St
- 3045 Blair Ave
- 3065 Blair Ave
- 2964 Millsboro Rd E
- 300 Deer Creek Ln
- 3075 Blair Ave
- 438 Summit Dr Unit 440
- 450 Summit Dr
- 2984 Millsboro Rd E