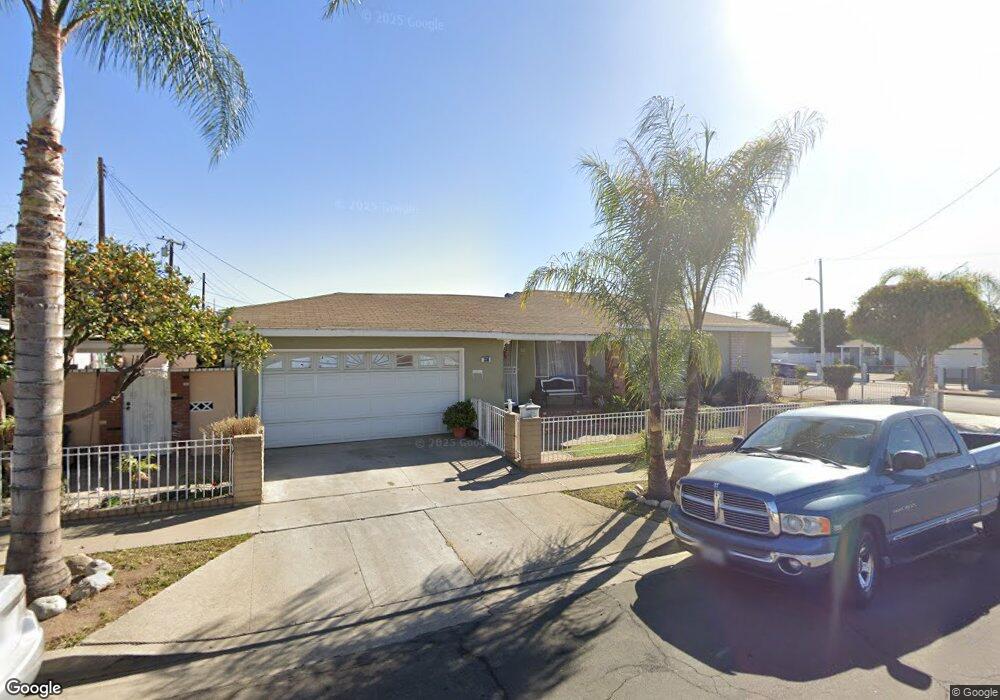
330 Melham Ave La Puente, CA 91744
Estimated Value: $697,993 - $752,000
3
Beds
2
Baths
1,388
Sq Ft
$525/Sq Ft
Est. Value
About This Home
This home is located at 330 Melham Ave, La Puente, CA 91744 and is currently estimated at $729,248, approximately $525 per square foot. 330 Melham Ave is a home located in Los Angeles County with nearby schools including Nelson Elementary School, Sparks Middle School, and La Puente High School.
Ownership History
Date
Name
Owned For
Owner Type
Purchase Details
Closed on
Nov 29, 1999
Sold by
Federal Home Loan Mortgage Corporation
Bought by
Jimenez Humberto and Jimenez Hilda
Current Estimated Value
Home Financials for this Owner
Home Financials are based on the most recent Mortgage that was taken out on this home.
Original Mortgage
$163,640
Outstanding Balance
$51,072
Interest Rate
7.82%
Mortgage Type
FHA
Estimated Equity
$678,176
Purchase Details
Closed on
Jul 22, 1999
Sold by
Sosa Dalia and Medallion Mtg Company
Bought by
Federal Home Loan Mortgage Corporation
Purchase Details
Closed on
Apr 5, 1995
Sold by
Murrill Robert and Murrill Mattie P
Bought by
Sosa Dalia
Home Financials for this Owner
Home Financials are based on the most recent Mortgage that was taken out on this home.
Original Mortgage
$153,900
Interest Rate
8.32%
Create a Home Valuation Report for This Property
The Home Valuation Report is an in-depth analysis detailing your home's value as well as a comparison with similar homes in the area
Home Values in the Area
Average Home Value in this Area
Purchase History
| Date | Buyer | Sale Price | Title Company |
|---|---|---|---|
| Jimenez Humberto | $165,000 | First American Title Co | |
| Federal Home Loan Mortgage Corporation | $135,182 | First American Title Ins Co | |
| Sosa Dalia | $162,000 | Orange Coast Title |
Source: Public Records
Mortgage History
| Date | Status | Borrower | Loan Amount |
|---|---|---|---|
| Open | Jimenez Humberto | $163,640 | |
| Previous Owner | Sosa Dalia | $153,900 |
Source: Public Records
Tax History Compared to Growth
Tax History
| Year | Tax Paid | Tax Assessment Tax Assessment Total Assessment is a certain percentage of the fair market value that is determined by local assessors to be the total taxable value of land and additions on the property. | Land | Improvement |
|---|---|---|---|---|
| 2025 | $3,508 | $253,574 | $128,633 | $124,941 |
| 2024 | $3,508 | $248,603 | $126,111 | $122,492 |
| 2023 | $3,423 | $243,730 | $123,639 | $120,091 |
| 2022 | $3,329 | $238,952 | $121,215 | $117,737 |
| 2021 | $3,268 | $234,268 | $118,839 | $115,429 |
| 2019 | $3,181 | $227,321 | $115,315 | $112,006 |
| 2018 | $3,022 | $222,864 | $113,054 | $109,810 |
| 2016 | $2,804 | $214,212 | $108,665 | $105,547 |
| 2015 | $2,754 | $210,995 | $107,033 | $103,962 |
| 2014 | $2,716 | $206,863 | $104,937 | $101,926 |
Source: Public Records
Map
Nearby Homes
- 357 Cadbrook Dr
- 14940 Beckner St
- 15246 Temple Ave
- 14972 Giordano St
- 750 Glenshaw Dr
- 15416 Giordano St
- 829 Foxworth Ave
- 822 Greenberry Dr
- 14612 Hutchcroft St
- 15732 Victoria Ave
- 736 Tonopah Ave
- 932 Shadydale Ave
- 545 N 5th St
- 544 N Orange Ave Unit B
- 14510 Amar Rd Unit J
- 14421 Flynn St
- 15625 Loukelton St
- 15879 Hill St
- 15900 Rowland St
- 433 Sunkist Ave
- 15109 Flagstaff St
- 342 Melham Ave
- 15115 Flagstaff St
- 15041 Flagstaff St
- 352 Melham Ave
- 337 Melham Ave
- 15104 Flagstaff St
- 341 Aldgate Ave
- 15050 Flagstaff St
- 343 Melham Ave
- 331 Aldgate Ave
- 15110 Flagstaff St
- 15044 Flagstaff St
- 358 Melham Ave
- 347 Melham Ave
- 345 Aldgate Ave
- 15116 Flagstaff St
- 15038 Flagstaff St
- 15031 Flagstaff St
- 353 Melham Ave