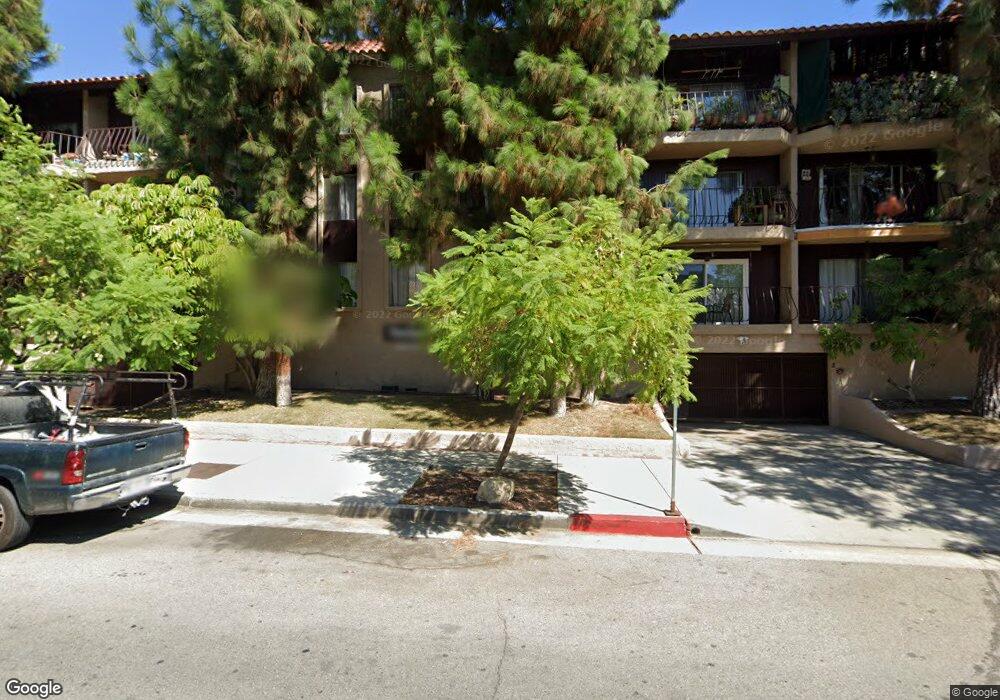
330 N Jackson St Unit 107 Glendale, CA 91206
City Center NeighborhoodEstimated Value: $414,295 - $464,000
Studio
1
Bath
670
Sq Ft
$658/Sq Ft
Est. Value
About This Home
This home is located at 330 N Jackson St Unit 107, Glendale, CA 91206 and is currently estimated at $440,574, approximately $657 per square foot. 330 N Jackson St Unit 107 is a home located in Los Angeles County with nearby schools including R.D. White Elementary School, Woodrow Wilson Middle School, and Glendale High School.
Ownership History
Date
Name
Owned For
Owner Type
Purchase Details
Closed on
Sep 23, 2004
Sold by
Costanios Eldon C
Bought by
Costanios Nelly A
Current Estimated Value
Home Financials for this Owner
Home Financials are based on the most recent Mortgage that was taken out on this home.
Original Mortgage
$172,000
Outstanding Balance
$84,871
Interest Rate
5.82%
Mortgage Type
New Conventional
Estimated Equity
$355,703
Purchase Details
Closed on
Sep 20, 2004
Sold by
Meinhold Thekla E and The Meinhold Family Trust
Bought by
Costanios Nelly A
Home Financials for this Owner
Home Financials are based on the most recent Mortgage that was taken out on this home.
Original Mortgage
$172,000
Outstanding Balance
$84,871
Interest Rate
5.82%
Mortgage Type
New Conventional
Estimated Equity
$355,703
Create a Home Valuation Report for This Property
The Home Valuation Report is an in-depth analysis detailing your home's value as well as a comparison with similar homes in the area
Home Values in the Area
Average Home Value in this Area
Purchase History
| Date | Buyer | Sale Price | Title Company |
|---|---|---|---|
| Costanios Nelly A | -- | Chicago Title | |
| Costanios Nelly A | $215,000 | Chicago Title |
Source: Public Records
Mortgage History
| Date | Status | Borrower | Loan Amount |
|---|---|---|---|
| Open | Costanios Nelly A | $172,000 | |
| Closed | Costanios Nelly A | $21,500 |
Source: Public Records
Tax History
| Year | Tax Paid | Tax Assessment Tax Assessment Total Assessment is a certain percentage of the fair market value that is determined by local assessors to be the total taxable value of land and additions on the property. | Land | Improvement |
|---|---|---|---|---|
| 2025 | $3,282 | $299,677 | $181,203 | $118,474 |
| 2024 | $3,282 | $293,801 | $177,650 | $116,151 |
| 2023 | $3,207 | $288,041 | $174,167 | $113,874 |
| 2022 | $3,149 | $282,394 | $170,752 | $111,642 |
| 2021 | $3,094 | $276,857 | $167,404 | $109,453 |
| 2019 | $2,974 | $268,647 | $162,440 | $106,207 |
| 2018 | $2,935 | $263,380 | $159,255 | $104,125 |
| 2016 | $2,798 | $253,155 | $153,072 | $100,083 |
| 2015 | $2,741 | $249,353 | $150,773 | $98,580 |
| 2014 | $2,401 | $215,000 | $129,500 | $85,500 |
Source: Public Records
Map
Nearby Homes
- 333 N Jackson St
- 330 N Jackson St Unit 314
- 310 N Jackson St Unit 104
- 411 N Jackson St Unit 104
- 312 N Louise St Unit 210
- 312 N Louise St Unit 108
- 300 N Isabel St Unit 10
- 219 N Isabel St Unit 5
- 215 N Kenwood St Unit 303
- 330 N Howard St Unit 212
- 510 N Jackson St Unit 301
- 515 N Jackson St Unit 116
- 520 N Howard St
- 612 N Louise St Unit 307
- 118 S Kenwood St Unit 305
- 121 S Jackson St
- 719 N Jackson St
- 126 Franklin Ct
- 232 N Belmont St
- 222 Monterey Rd Unit 104
- 330 N Jackson St Unit 124
- 330 N Jackson St Unit 207
- 330 N Jackson St
- 330 N Jackson St Unit 311
- 330 N Jackson St Unit 310
- 330 N Jackson St Unit 309
- 330 N Jackson St Unit 308
- 330 N Jackson St Unit 307
- 330 N Jackson St Unit 224
- 330 N Jackson St Unit 222
- 330 N Jackson St Unit 220
- 330 N Jackson St Unit 219
- 330 N Jackson St Unit 218
- 330 N Jackson St Unit 217
- 330 N Jackson St Unit 216
- 330 N Jackson St Unit 215
- 330 N Jackson St Unit 214
- 330 N Jackson St Unit 213
- 330 N Jackson St Unit 212
- 330 N Jackson St Unit 211
Your Personal Tour Guide
Ask me questions while you tour the home.