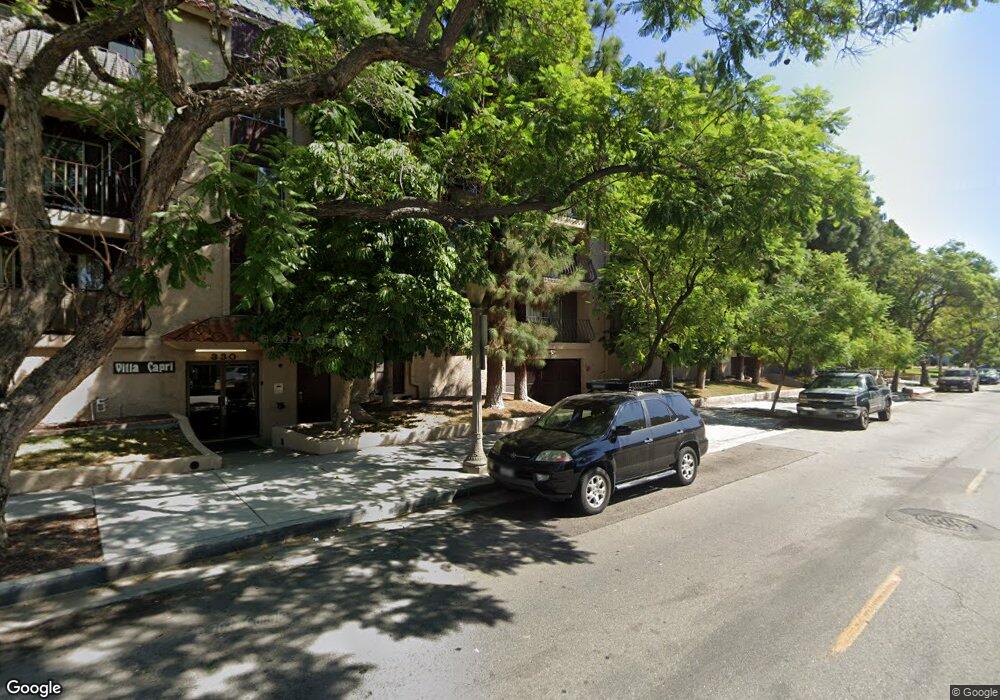
330 N Jackson St Unit 215 Glendale, CA 91206
City Center NeighborhoodEstimated Value: $476,581 - $528,000
About This Home
This home is located at 330 N Jackson St Unit 215, Glendale, CA 91206 and is currently estimated at $513,145, approximately $597 per square foot. 330 N Jackson St Unit 215 is a home located in Los Angeles County with nearby schools including R.D. White Elementary School, Woodrow Wilson Middle School, and Glendale High School.
Ownership History
We collect this data history from publicly available records. To have your information removed, we recommend requesting removal directly through your county’s website.
Purchase Details
Home Financials for this Owner
Home Financials are based on the most recent Mortgage that was taken out on this home.Purchase Details
Purchase Details
Home Financials for this Owner
Home Financials are based on the most recent Mortgage that was taken out on this home.Home Values in the Area
Average Home Value in this Area
Purchase History
We collect this data history from publicly available records. To have your information removed, we recommend requesting removal directly through your county’s website.
| Date | Buyer | Sale Price | Title Company |
|---|---|---|---|
| -- | Alliance Title Company | ||
| -- | -- | ||
| -- | Gateway Title Company | ||
| $73,000 | Gateway Title |
Mortgage History
We collect this data history from publicly available records. To have your information removed, we recommend requesting removal directly through your county’s website.
| Date | Status | Borrower | Loan Amount |
|---|---|---|---|
| Open | $190,000 | ||
| Closed | $69,350 |
Tax History
We collect this data history from publicly available records. To have your information removed, we recommend requesting removal directly through your county’s website.
| Year | Tax Paid | Tax Assessment Tax Assessment Total Assessment is a certain percentage of the fair market value that is determined by local assessors to be the total taxable value of land and additions on the property. | Land | Improvement |
|---|---|---|---|---|
| 2025 | $1,382 | $116,528 | $23,294 | $93,234 |
| 2024 | $1,345 | $114,244 | $22,838 | $91,406 |
| 2023 | $1,316 | $112,005 | $22,391 | $89,614 |
| 2022 | $1,290 | $109,809 | $21,952 | $87,857 |
| 2021 | $1,264 | $107,657 | $21,522 | $86,135 |
| 2019 | $1,216 | $104,466 | $20,885 | $83,581 |
| 2018 | $1,197 | $102,419 | $20,476 | $81,943 |
| 2016 | $1,132 | $98,444 | $19,682 | $78,762 |
| 2015 | $1,110 | $96,966 | $19,387 | $77,579 |
| 2014 | $1,108 | $95,068 | $19,008 | $76,060 |
Map
- 330 N Jackson St Unit 116
- 310 N Jackson St Unit 104
- 331 N Isabel St Unit 4
- 322 N Isabel St
- 300 N Isabel St Unit 10
- 330 N Howard St Unit 108
- 236 N Louise St Unit 104
- 432 N Kenwood St Unit 206
- 315 N Louise St Unit 103
- 215 N Kenwood St Unit 303
- 211 E California Ave Unit B7
- 515 N Jackson St Unit 206
- 510 N Maryland Ave Unit 318
- 620 N Kenwood St Unit 208
- 121 S Jackson St
- 118 S Kenwood St Unit 305
- 118 S Kenwood St Unit 407
- 118 S Kenwood St Unit 506
- 320 N Belmont St
- 232 N Belmont St
- 330 N Jackson St Unit 124
- 330 N Jackson St Unit 207
- 330 N Jackson St
- 330 N Jackson St Unit 311
- 330 N Jackson St Unit 310
- 330 N Jackson St Unit 309
- 330 N Jackson St Unit 308
- 330 N Jackson St Unit 307
- 330 N Jackson St Unit 107
- 330 N Jackson St Unit 224
- 330 N Jackson St Unit 222
- 330 N Jackson St Unit 220
- 330 N Jackson St Unit 219
- 330 N Jackson St Unit 218
- 330 N Jackson St Unit 217
- 330 N Jackson St Unit 216
- 330 N Jackson St Unit 214
- 330 N Jackson St Unit 213
- 330 N Jackson St Unit 212
- 330 N Jackson St Unit 211
Ask me questions while you tour the home.