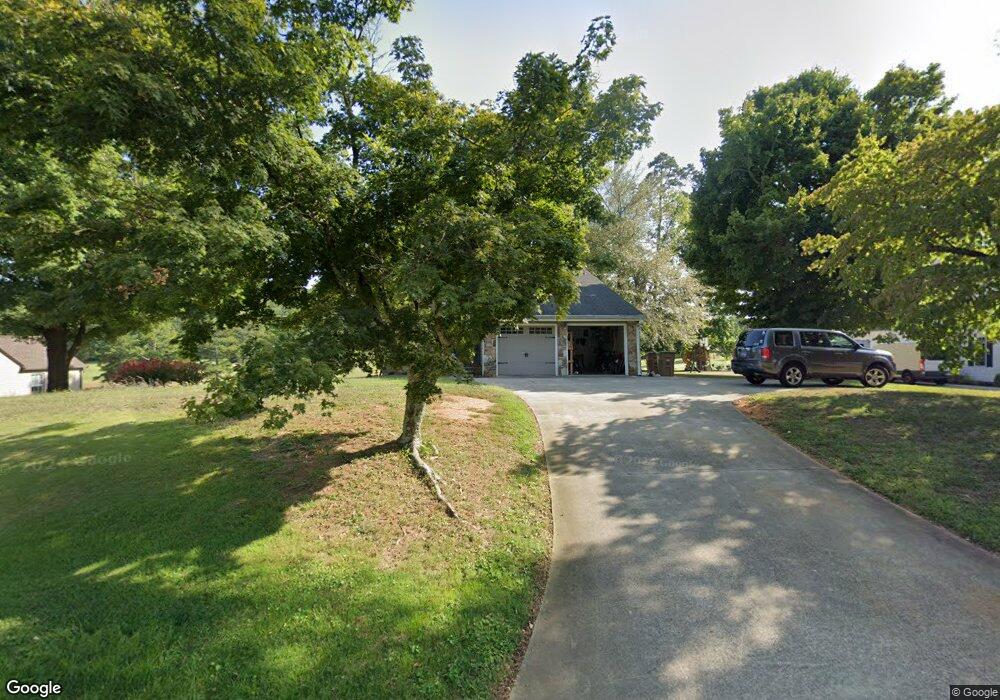
330 Nob North Dr Cohutta, GA 30710
Estimated Value: $399,000 - $536,000
4
Beds
3
Baths
2,867
Sq Ft
$162/Sq Ft
Est. Value
About This Home
This home is located at 330 Nob North Dr, Cohutta, GA 30710 and is currently estimated at $464,481, approximately $162 per square foot. 330 Nob North Dr is a home located in Whitfield County with nearby schools including Varnell Elementary School and Coahulla Creek High School.
Ownership History
Date
Name
Owned For
Owner Type
Purchase Details
Closed on
May 3, 2021
Sold by
Bates Charles D
Bought by
Petersen Allison Lucille and Petersen Matthew Lee
Current Estimated Value
Home Financials for this Owner
Home Financials are based on the most recent Mortgage that was taken out on this home.
Original Mortgage
$335,775
Outstanding Balance
$304,296
Interest Rate
3.1%
Mortgage Type
New Conventional
Estimated Equity
$160,185
Purchase Details
Closed on
Feb 19, 2008
Sold by
Doyle Michael O
Bought by
Bates Charles D and Bates Mallory C
Home Financials for this Owner
Home Financials are based on the most recent Mortgage that was taken out on this home.
Original Mortgage
$160,000
Interest Rate
5.46%
Mortgage Type
New Conventional
Purchase Details
Closed on
Sep 1, 1999
Bought by
Doyle Michael O and Doyle Ruth A
Create a Home Valuation Report for This Property
The Home Valuation Report is an in-depth analysis detailing your home's value as well as a comparison with similar homes in the area
Home Values in the Area
Average Home Value in this Area
Purchase History
| Date | Buyer | Sale Price | Title Company |
|---|---|---|---|
| Petersen Allison Lucille | $330,000 | -- | |
| Bates Charles D | $200,000 | -- | |
| Doyle Michael O | $155,000 | -- |
Source: Public Records
Mortgage History
| Date | Status | Borrower | Loan Amount |
|---|---|---|---|
| Open | Petersen Allison Lucille | $335,775 | |
| Previous Owner | Bates Charles D | $160,000 |
Source: Public Records
Tax History Compared to Growth
Tax History
| Year | Tax Paid | Tax Assessment Tax Assessment Total Assessment is a certain percentage of the fair market value that is determined by local assessors to be the total taxable value of land and additions on the property. | Land | Improvement |
|---|---|---|---|---|
| 2024 | $3,292 | $175,886 | $15,200 | $160,686 |
| 2023 | $3,292 | $116,656 | $12,600 | $104,056 |
| 2022 | $2,323 | $87,309 | $12,600 | $74,709 |
| 2021 | $2,751 | $87,309 | $12,600 | $74,709 |
| 2020 | $2,751 | $87,309 | $12,600 | $74,709 |
| 2019 | $2,425 | $87,309 | $12,600 | $74,709 |
| 2018 | $2,185 | $78,637 | $12,600 | $66,037 |
| 2017 | $2,186 | $78,637 | $12,600 | $66,037 |
| 2016 | $1,934 | $72,661 | $12,600 | $60,061 |
| 2014 | $1,757 | $72,661 | $12,600 | $60,061 |
| 2013 | -- | $72,660 | $12,600 | $60,060 |
Source: Public Records
Map
Nearby Homes
- 353 Golf View Dr
- 4401 Panorama Dr
- 355 Golf View Dr
- 4405 Panorama Dr
- 327 Golf View Dr
- 139 N Hills Dr
- 4503 Crestway Dr
- 4424 Trailwood Dr
- 4323 Cronan Dr
- 4511 Crestway Dr
- 4510 Bluffwood Way
- 0 Tee Top Dr
- 4416 Wedgewood Ln
- Lot 93 Country Way
- Lot 92 Country Way
- 103 Paddle Wheel Ct
- Tract 8 Wheeler Dam Rd
- Tract 6 Wheeler Dam Rd
- Tract 9 Wheeler Dam Rd
- Tract 2 Wheeler Dam Rd
- 330 Nob Dr N
- 328 Nob North Dr
- 332 Nob North Dr
- 331 Nob North Dr
- 329 Nob North Dr
- 334 Nob North Dr
- 326 Nob North Dr
- 327 Nob North Dr
- 335 Nob North Dr
- 350 Nob Dr N
- 336 Nob North Dr
- Lot 8 Nob Dr N
- Lot 1/6 Nob Dr N
- 337 Nob Dr N
- 337 Nob North Dr
- 325 Nob North Dr
- 338 Nob North Dr
- 339 Nob North Dr
- 325 Nob Dr N
- 323 Nob Dr N