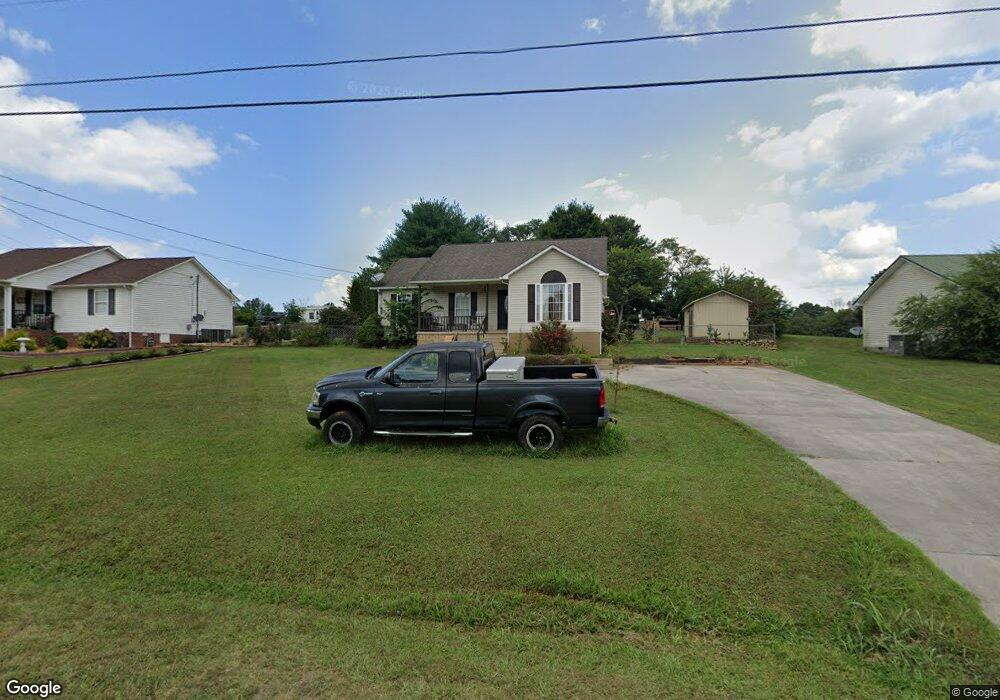
330 Penny Ln Sparta, TN 38583
Estimated Value: $260,000 - $297,000
3
Beds
2
Baths
1,488
Sq Ft
$185/Sq Ft
Est. Value
About This Home
This home is located at 330 Penny Ln, Sparta, TN 38583 and is currently estimated at $275,578, approximately $185 per square foot. 330 Penny Ln is a home located in White County with nearby schools including Findlay Elementary School, White County Middle School, and White County High School.
Ownership History
Date
Name
Owned For
Owner Type
Purchase Details
Closed on
Jun 29, 2006
Sold by
Hopkins Willard L
Bought by
Jennifer Hollingsworth
Current Estimated Value
Purchase Details
Closed on
Apr 26, 2000
Bought by
Chase Manhattan Mort Corp
Purchase Details
Closed on
Apr 24, 1997
Sold by
Burt Sims
Bought by
Stolz and Shirley
Home Financials for this Owner
Home Financials are based on the most recent Mortgage that was taken out on this home.
Original Mortgage
$46,400
Interest Rate
7.85%
Purchase Details
Closed on
Oct 15, 1996
Sold by
Mcclain and Sally
Bought by
Burt Sims
Purchase Details
Closed on
Jun 8, 1995
Sold by
Johnson James H
Bought by
Roland Mcclain
Purchase Details
Closed on
Apr 2, 1993
Bought by
Johnson James H Jr Stephanie
Purchase Details
Closed on
Feb 15, 1991
Bought by
Brasel Carl
Purchase Details
Closed on
Jan 1, 1987
Bought by
Sims Joe and Sims Dawn
Create a Home Valuation Report for This Property
The Home Valuation Report is an in-depth analysis detailing your home's value as well as a comparison with similar homes in the area
Home Values in the Area
Average Home Value in this Area
Purchase History
| Date | Buyer | Sale Price | Title Company |
|---|---|---|---|
| Jennifer Hollingsworth | $72,000 | -- | |
| Chase Manhattan Mort Corp | $66,500 | -- | |
| Stolz | $58,000 | -- | |
| Burt Sims | $3,500 | -- | |
| Roland Mcclain | $3,500 | -- | |
| Johnson James H Jr Stephanie | -- | -- | |
| Brasel Carl | -- | -- | |
| Sims Joe | -- | -- |
Source: Public Records
Mortgage History
| Date | Status | Borrower | Loan Amount |
|---|---|---|---|
| Previous Owner | Sims Joe | $46,400 |
Source: Public Records
Tax History Compared to Growth
Tax History
| Year | Tax Paid | Tax Assessment Tax Assessment Total Assessment is a certain percentage of the fair market value that is determined by local assessors to be the total taxable value of land and additions on the property. | Land | Improvement |
|---|---|---|---|---|
| 2025 | $495 | $46,875 | $0 | $0 |
| 2024 | $495 | $24,125 | $2,500 | $21,625 |
| 2023 | $495 | $24,125 | $2,500 | $21,625 |
| 2022 | $495 | $24,125 | $2,500 | $21,625 |
| 2021 | $495 | $24,125 | $2,500 | $21,625 |
| 2020 | $495 | $24,125 | $2,500 | $21,625 |
| 2019 | $426 | $20,800 | $1,875 | $18,925 |
| 2018 | $426 | $20,800 | $1,875 | $18,925 |
| 2017 | $359 | $20,800 | $1,875 | $18,925 |
| 2016 | $359 | $17,525 | $1,875 | $15,650 |
| 2015 | $324 | $17,525 | $1,875 | $15,650 |
| 2014 | -- | $17,525 | $1,875 | $15,650 |
| 2013 | -- | $17,675 | $1,875 | $15,800 |
Source: Public Records
Map
Nearby Homes
- 2696 Doran Rd
- 144 Liberty Rd
- 530 Meadows Rd
- 3828 Blue Springs Rd
- 3035 Monterey Hwy
- 1178 Ray Broyles Rd
- lot 3 Joppa Rd
- lot 1 Joppa Rd
- lot 2 Joppa Rd
- 448 Pistol Rd
- 0 Crouch Rd
- 579 Blue Springs Rd
- 0 Inland Ct Unit RTC3042295
- 7029 Monterey Hwy
- 1945 Golden Mountain Rd
- 427 Frank Sims Rd
- Tract 1 Wildcat Cove Rd
- 3570 Golden Mountain Rd
- 548 Turn Table Rd
- 548 Turntable Rd