330 S 38th St Boulder, CO 80305
South Boulder NeighborhoodEstimated Value: $985,000 - $1,126,000
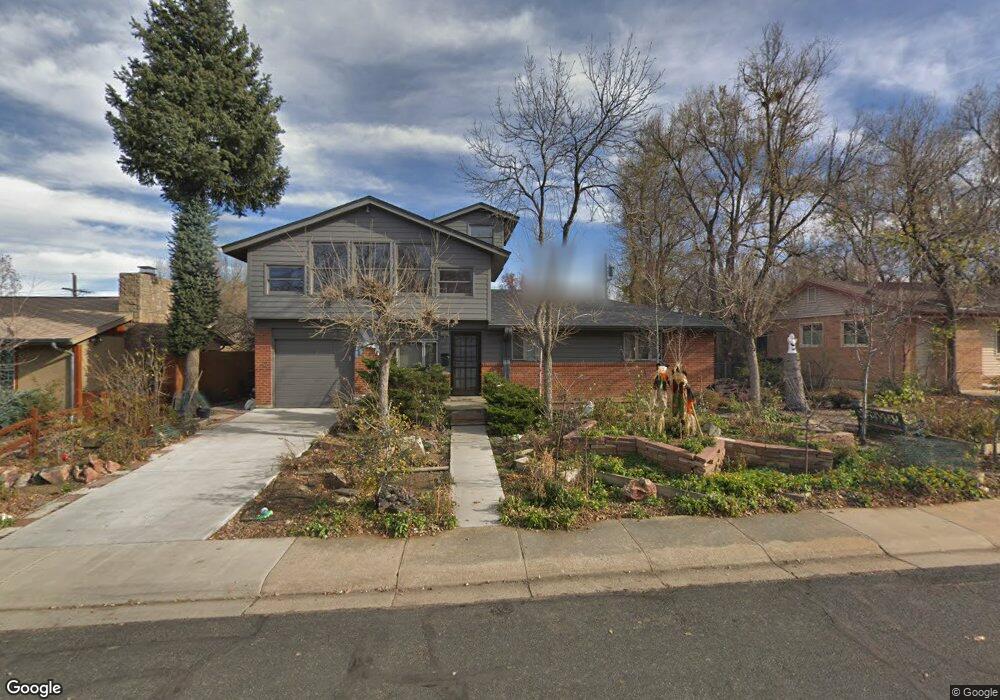
About This Home
This home is located at 330 S 38th St, Boulder, CO 80305 and is currently estimated at $1,031,701, approximately $505 per square foot. 330 S 38th St is a home located in Boulder County with nearby schools including Creekside Elementary School, Manhattan Middle School of the Arts & Academics, and Fairview High School.
Ownership History
We collect this data history from publicly available records. To have your information removed, we recommend requesting removal directly through your county’s website.
Purchase Details
Purchase Details
Purchase Details
Purchase Details
Home Values in the Area
Average Home Value in this Area
Purchase History
We collect this data history from publicly available records. To have your information removed, we recommend requesting removal directly through your county’s website.
| Date | Buyer | Sale Price | Title Company |
|---|---|---|---|
| -- | None Listed On Document | ||
| -- | None Listed On Document | ||
| -- | -- | ||
| $24,200 | -- |
Tax History
We collect this data history from publicly available records. To have your information removed, we recommend requesting removal directly through your county’s website.
| Year | Tax Paid | Tax Assessment Tax Assessment Total Assessment is a certain percentage of the fair market value that is determined by local assessors to be the total taxable value of land and additions on the property. | Land | Improvement |
|---|---|---|---|---|
| 2026 | $5,839 | $66,626 | $38,794 | $27,832 |
| 2025 | $5,839 | $66,626 | $38,794 | $27,832 |
| 2024 | $5,929 | $61,237 | $35,656 | $25,581 |
| 2023 | $5,248 | $67,469 | $41,781 | $29,373 |
| 2022 | $4,538 | $55,815 | $30,990 | $24,825 |
| 2021 | $4,327 | $57,422 | $31,882 | $25,540 |
| 2020 | $4,190 | $55,291 | $26,026 | $29,265 |
| 2019 | $4,126 | $55,291 | $26,026 | $29,265 |
| 2018 | $3,803 | $51,062 | $23,976 | $27,086 |
| 2017 | $3,684 | $56,453 | $26,507 | $29,946 |
| 2016 | $3,203 | $44,966 | $17,990 | $26,976 |
| 2015 | $3,033 | $35,104 | $17,990 | $17,114 |
| 2014 | $2,282 | $35,104 | $17,990 | $17,114 |
Map
- 265 S 39th St
- 160 S 36th St
- 430 S 42nd St
- 3280 Dartmouth Ave
- 405 S 44th St
- 615 S 42nd St
- 350 Bates Ave
- 3565 Martin Dr
- 720 Gillaspie Dr
- 2955 Stanford Ave
- 2905 Vassar Dr
- 915 Yale Rd
- 110 Mohawk Dr
- 2585 Kohler Dr
- 1069 Berea Dr
- 4835 Moorhead Ave
- 628 Tantra Dr Unit B
- 980 Hartford Dr
- 1095 Edinboro Dr
- 1010 Hartford Dr
Ask me questions while you tour the home.