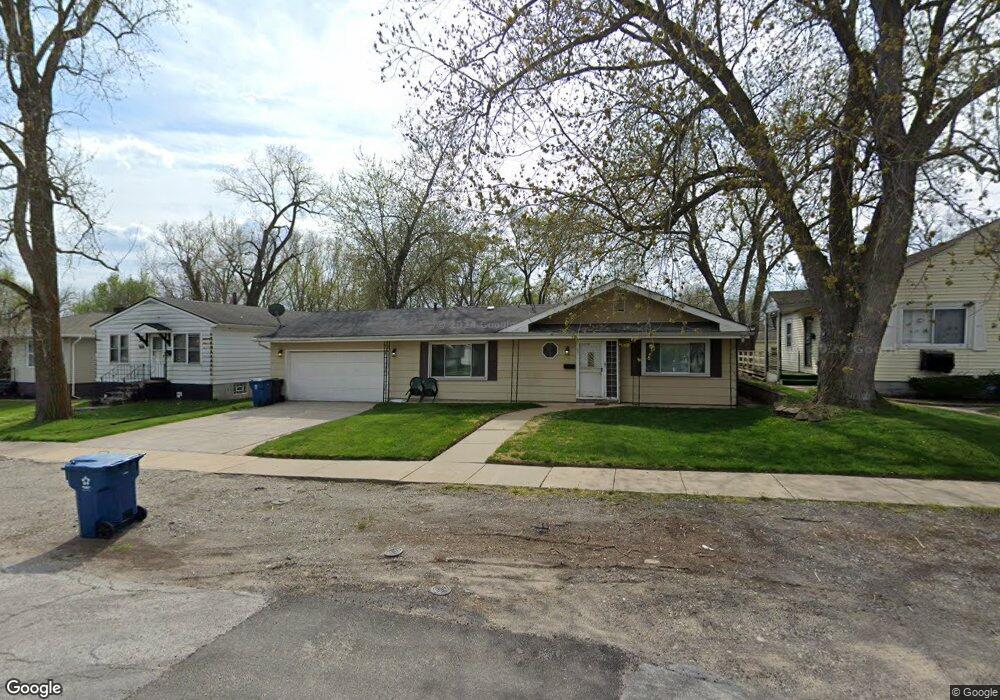
330 S Jasper St Gary, IN 46403
Miller NeighborhoodEstimated Value: $156,000 - $204,000
2
Beds
3
Baths
2,085
Sq Ft
$90/Sq Ft
Est. Value
About This Home
This home is located at 330 S Jasper St, Gary, IN 46403 and is currently estimated at $188,426, approximately $90 per square foot. 330 S Jasper St is a home located in Lake County with nearby schools including Banneker Elementary at Marquette, Gary Middle School, and West Side Leadership Academy.
Ownership History
Date
Name
Owned For
Owner Type
Purchase Details
Closed on
Jul 31, 2006
Sold by
Livas Pete
Bought by
Smith Wilbert
Current Estimated Value
Home Financials for this Owner
Home Financials are based on the most recent Mortgage that was taken out on this home.
Original Mortgage
$118,750
Outstanding Balance
$80,201
Interest Rate
9.62%
Mortgage Type
Purchase Money Mortgage
Estimated Equity
$108,225
Purchase Details
Closed on
Mar 20, 2006
Sold by
Austin Bertrand Inc
Bought by
Livas Pete
Home Financials for this Owner
Home Financials are based on the most recent Mortgage that was taken out on this home.
Original Mortgage
$101,600
Interest Rate
10.7%
Mortgage Type
Fannie Mae Freddie Mac
Purchase Details
Closed on
Oct 28, 2005
Sold by
Jpmorgan Chase Bank Na
Bought by
Kerusso Konstruction Kompany
Home Financials for this Owner
Home Financials are based on the most recent Mortgage that was taken out on this home.
Original Mortgage
$79,285
Interest Rate
6.36%
Mortgage Type
Purchase Money Mortgage
Purchase Details
Closed on
Oct 27, 2005
Sold by
Kerusso Konstruction Kompany Llc
Bought by
Austin Bertrand Inc and 330 S Jasper Street Land Trust
Home Financials for this Owner
Home Financials are based on the most recent Mortgage that was taken out on this home.
Original Mortgage
$79,285
Interest Rate
6.36%
Mortgage Type
Purchase Money Mortgage
Purchase Details
Closed on
Aug 5, 2005
Sold by
Gross Charles O and Gross Alice L
Bought by
Jpmorgan Chase Bank Na
Create a Home Valuation Report for This Property
The Home Valuation Report is an in-depth analysis detailing your home's value as well as a comparison with similar homes in the area
Home Values in the Area
Average Home Value in this Area
Purchase History
| Date | Buyer | Sale Price | Title Company |
|---|---|---|---|
| Smith Wilbert | -- | Meridian Title Corp | |
| Livas Pete | -- | Meridian Title Corp | |
| Kerusso Konstruction Kompany | -- | -- | |
| Austin Bertrand Inc | -- | Meridian Title Corp | |
| Jpmorgan Chase Bank Na | $69,524 | -- |
Source: Public Records
Mortgage History
| Date | Status | Borrower | Loan Amount |
|---|---|---|---|
| Open | Smith Wilbert | $118,750 | |
| Previous Owner | Livas Pete | $101,600 | |
| Previous Owner | Austin Bertrand Inc | $79,285 |
Source: Public Records
Tax History
| Year | Tax Paid | Tax Assessment Tax Assessment Total Assessment is a certain percentage of the fair market value that is determined by local assessors to be the total taxable value of land and additions on the property. | Land | Improvement |
|---|---|---|---|---|
| 2025 | $990 | $89,600 | $15,100 | $74,500 |
| 2024 | $7,256 | $86,900 | $16,900 | $70,000 |
| 2023 | $930 | $82,300 | $16,900 | $65,400 |
| 2022 | $679 | $60,700 | $10,000 | $50,700 |
| 2021 | $617 | $55,300 | $10,000 | $45,300 |
| 2020 | $659 | $59,000 | $10,000 | $49,000 |
| 2019 | $637 | $57,700 | $9,800 | $47,900 |
| 2018 | $624 | $55,000 | $9,400 | $45,600 |
| 2017 | $622 | $54,400 | $9,200 | $45,200 |
| 2016 | $640 | $56,500 | $9,200 | $47,300 |
| 2014 | $934 | $85,500 | $11,100 | $74,400 |
| 2013 | $884 | $83,000 | $11,200 | $71,800 |
Source: Public Records
Map
Nearby Homes
- 6516 E 3rd Place
- 6610 E 3rd Ave
- 6328 E 3rd Ave
- 6568 Miller Ave
- 6741 Ash Place
- 6400 Ash Ave
- 9201 E 5th Ave
- 7033 E 1st Ave
- 231-35 S Marion St
- 7030 E 1st Ave
- 7235 E 1st Ave
- 316 N Knox St
- 845 Floyd St
- 6225 Forest Ave
- 1100 S Lake St
- 866 Floyd St
- 5544 E 10th Ave
- 1157 S Hamilton St
- 6938 Ironwood Ave
- 7111 Ironwood Ave
- 324 S Jasper St
- 318 S Jasper St
- 336 S Jasper St
- 340 S Jasper St
- 314 S Jasper St
- 341 S Grand Blvd
- 327 S Grand Blvd
- 355 S Grand Blvd
- 321 S Jasper St
- 348 S Jasper St
- 310 S Jasper St
- 323 S Grand Blvd
- 6501 E 3rd Place
- 6508 E 3rd Place
- 335 S Grand Blvd
- 321 S Grand Blvd
- 304 S Jasper St
- 6507 E 3rd Place
- 354 S Jasper St
- 300 S Jasper St
Your Personal Tour Guide
Ask me questions while you tour the home.